Monitor Application Health
20 MINUTE EXERCISE
In this lab we will learn how to monitor application health using OpenShift health probes and how you can see container resource consumption using metrics.
Understanding Liveness Probes
What happens if you DON’T setup Liveness checks?
Imagine the Inventory Service is stuck in a state (Deadlock, NullPointer exception, Out of Memory, ..) where it cannot perform as it should. Let’s access inside the container and simulate this state.
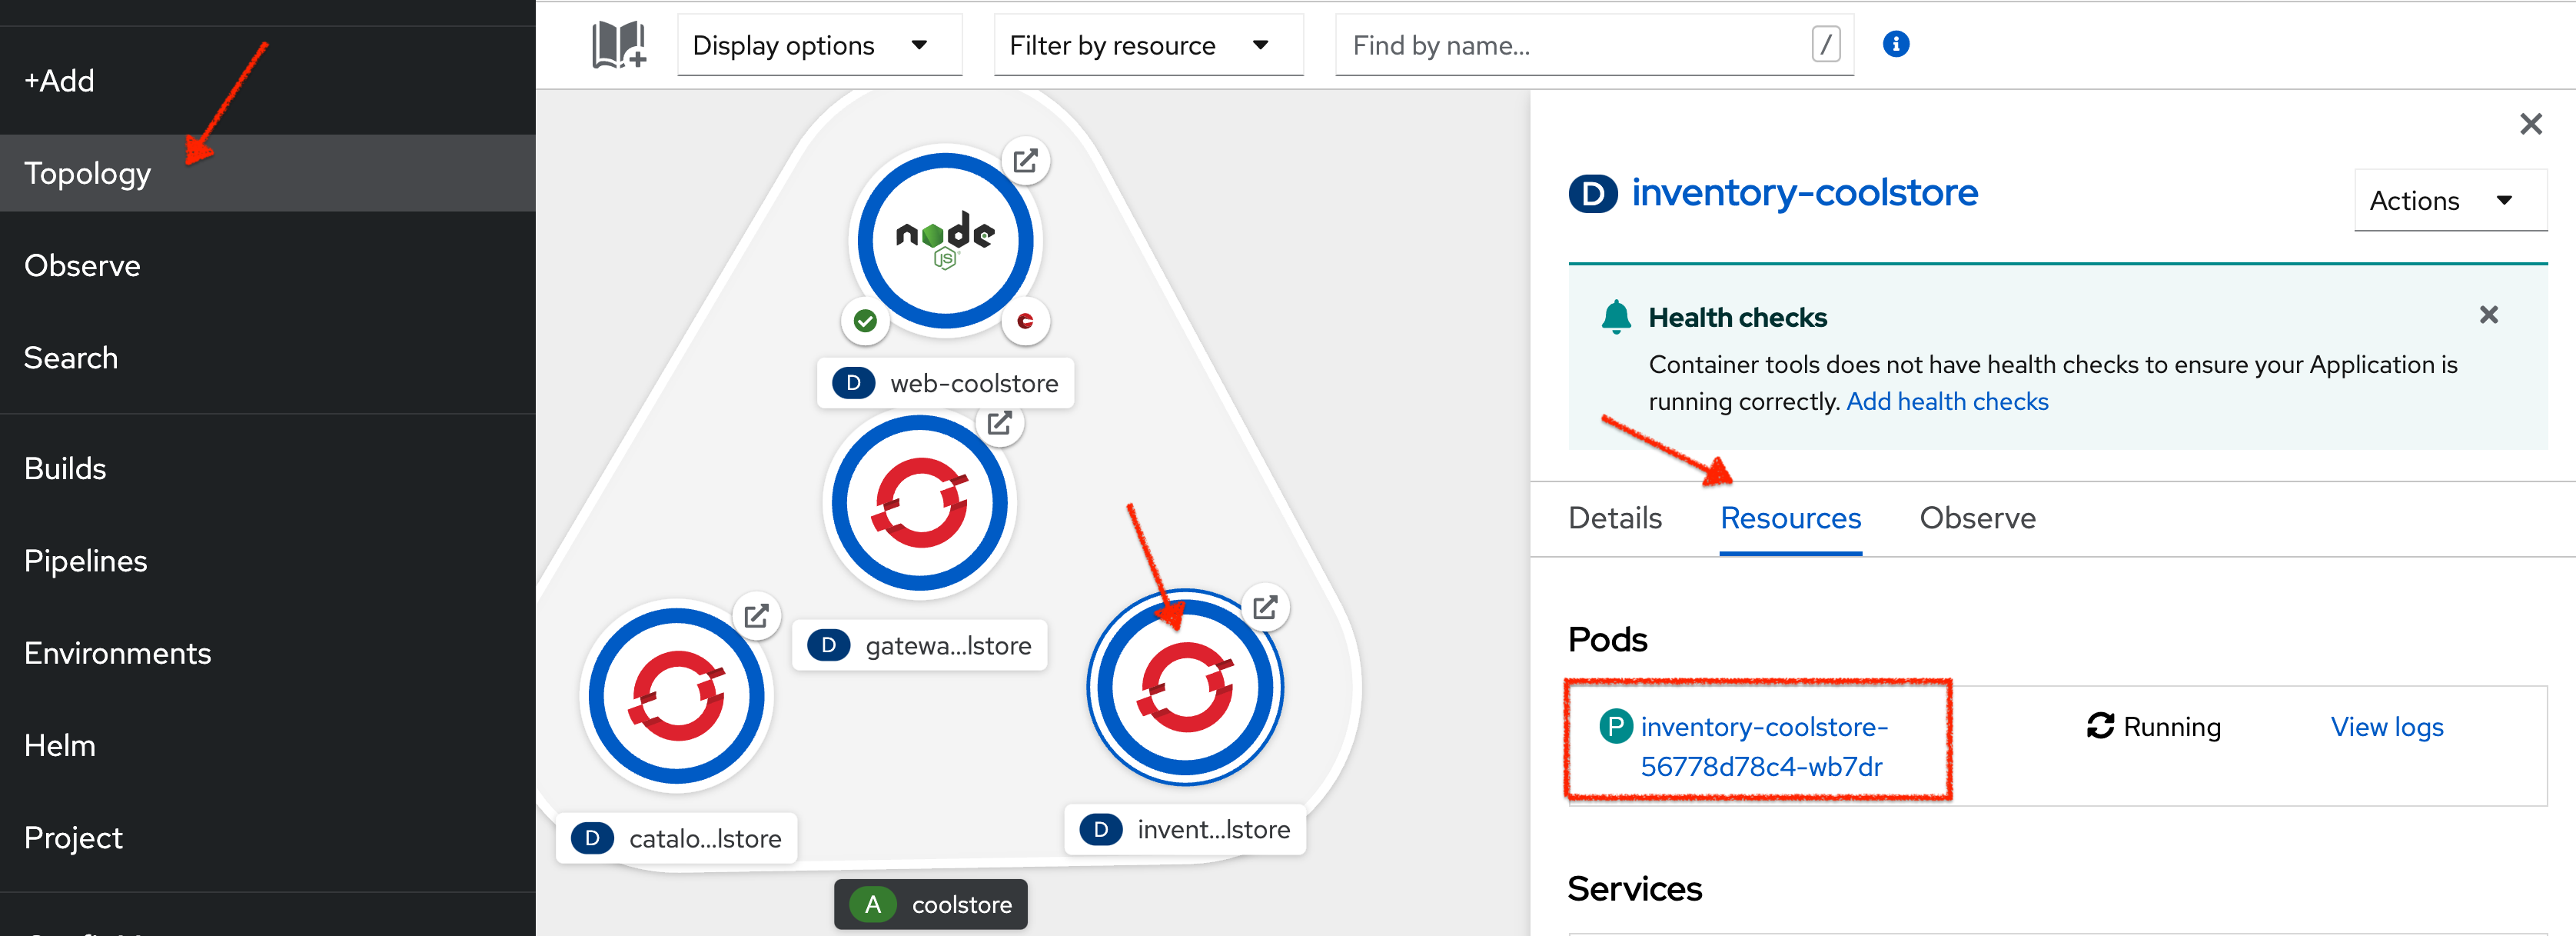
In the OpenShift Web Console, from the Developer view,
click on 'Topology' → '(D) inventory-coolstore' → 'Resources' → 'P inventory-coolstore-x-xxxxx'
Then, from the Terminal tab, run the following command:
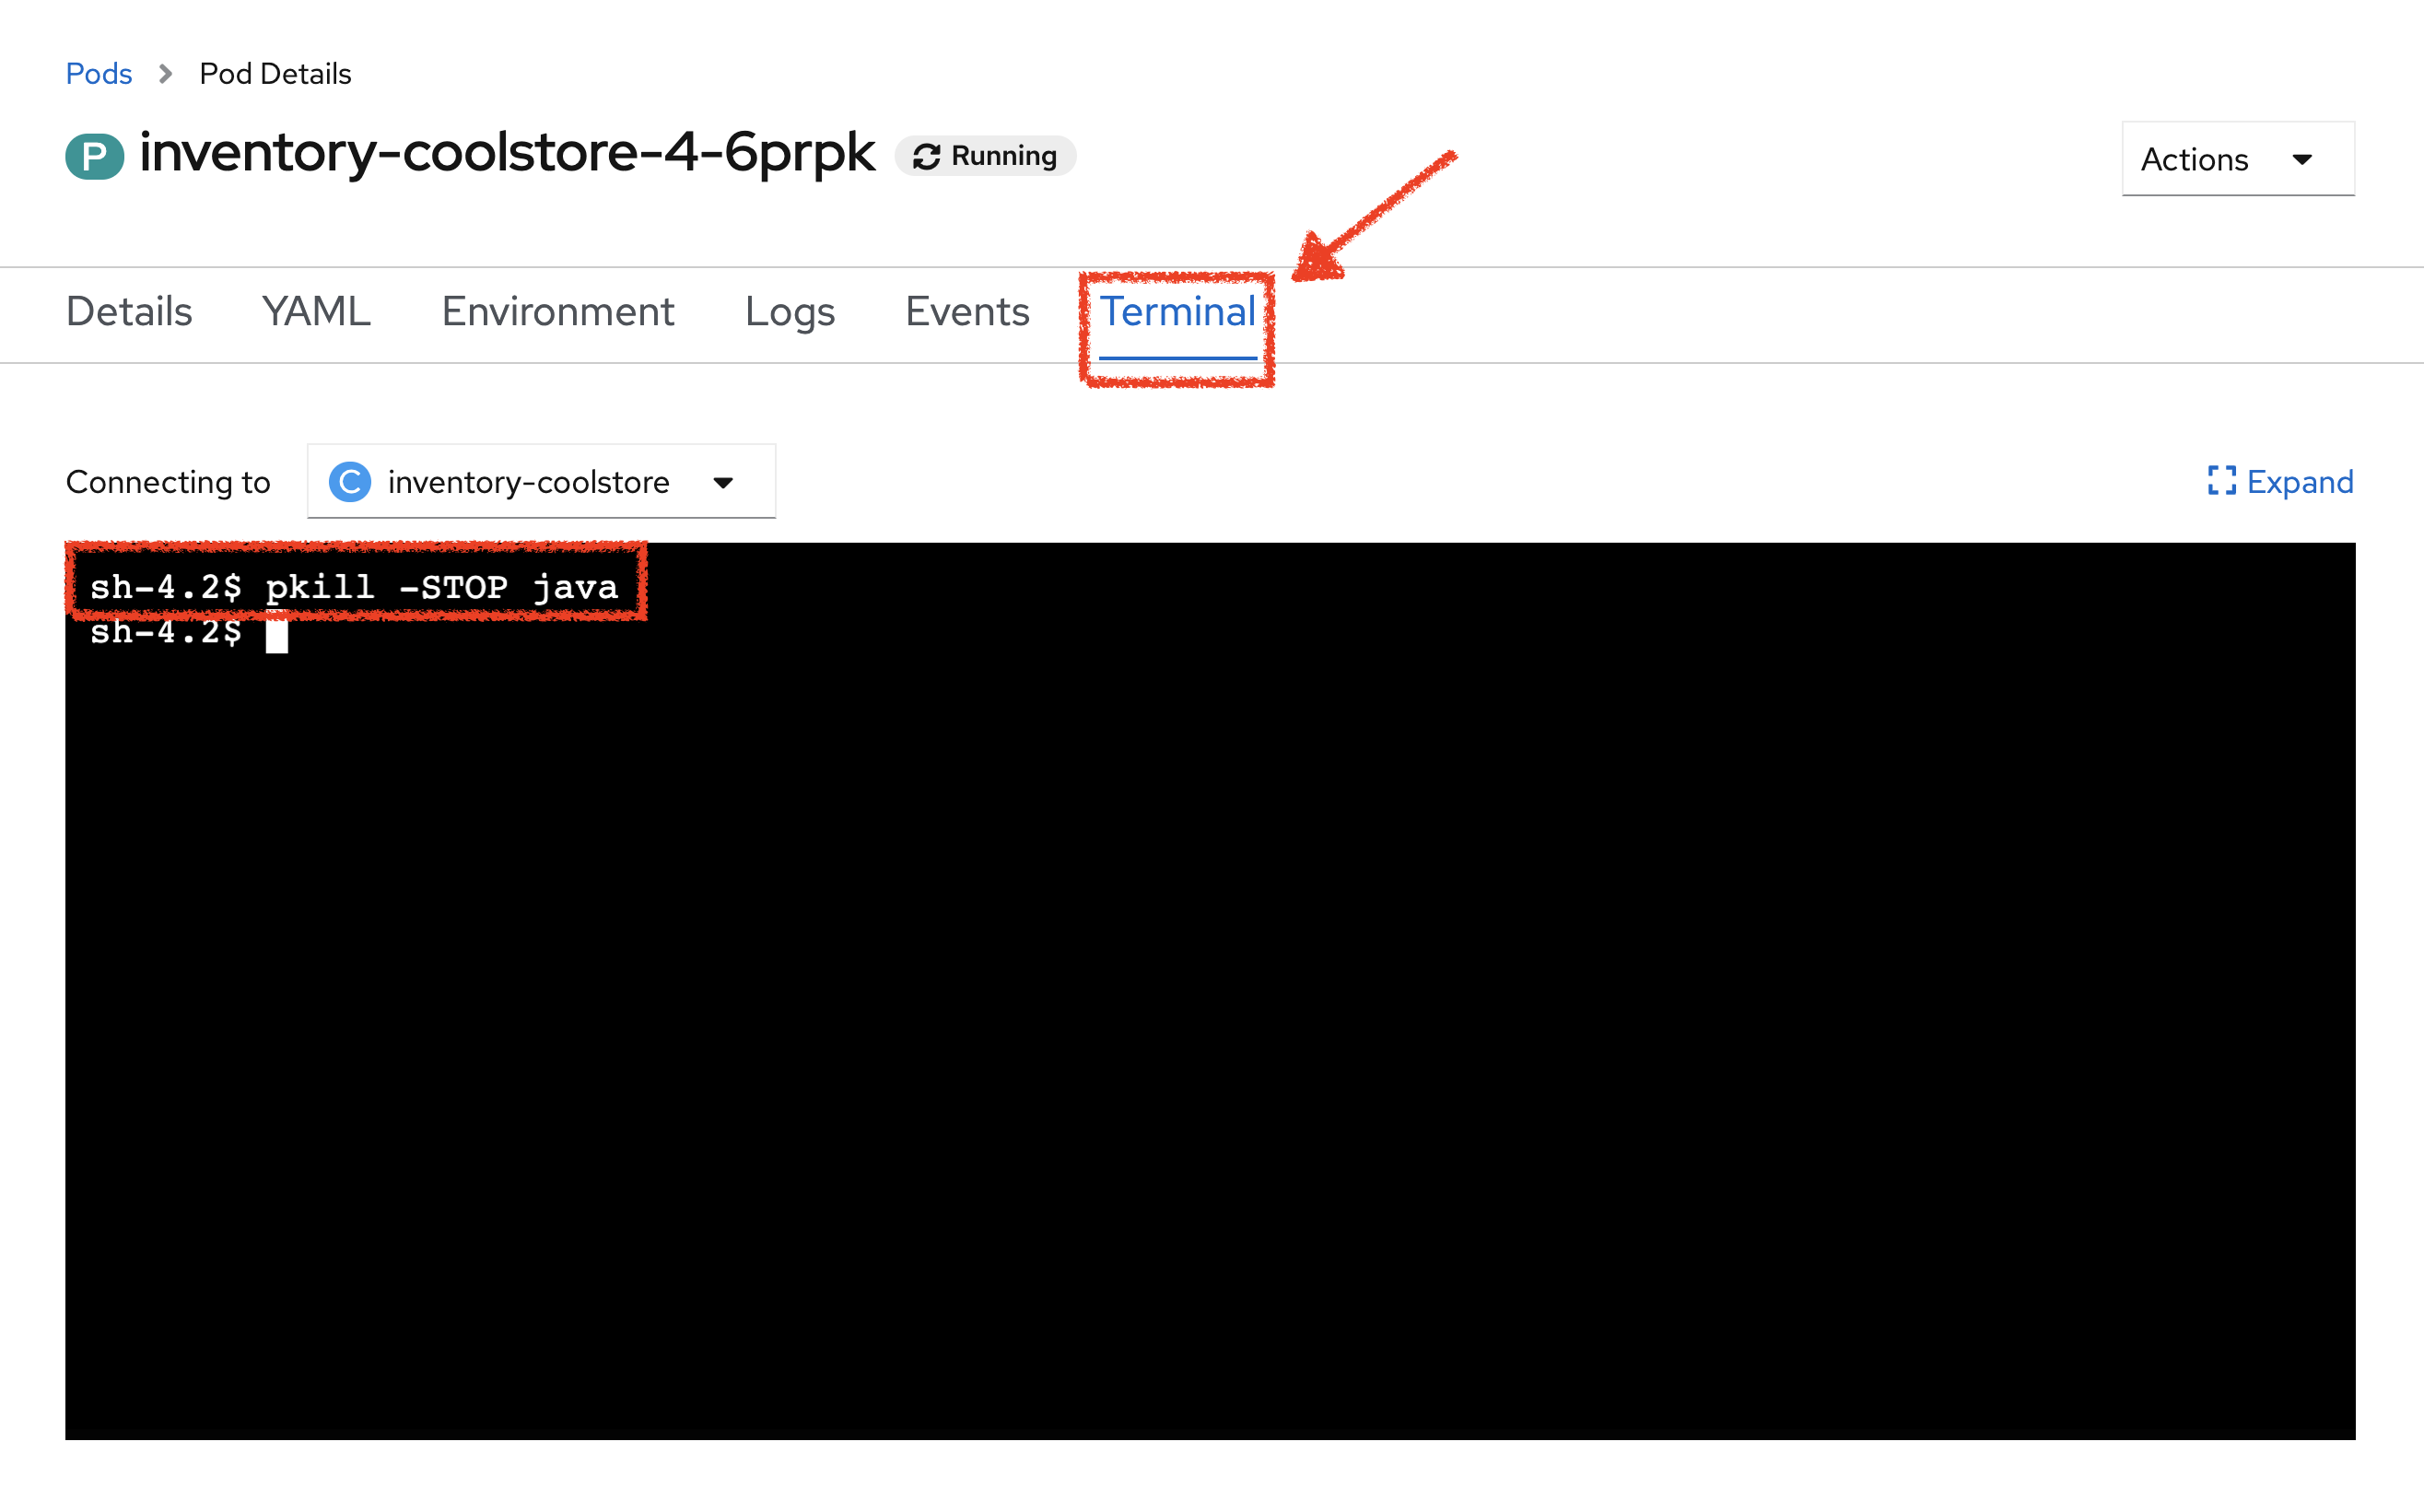
pkill -STOP javaSo you just suspend the Inventory Service java process to simulate a stuck situation.
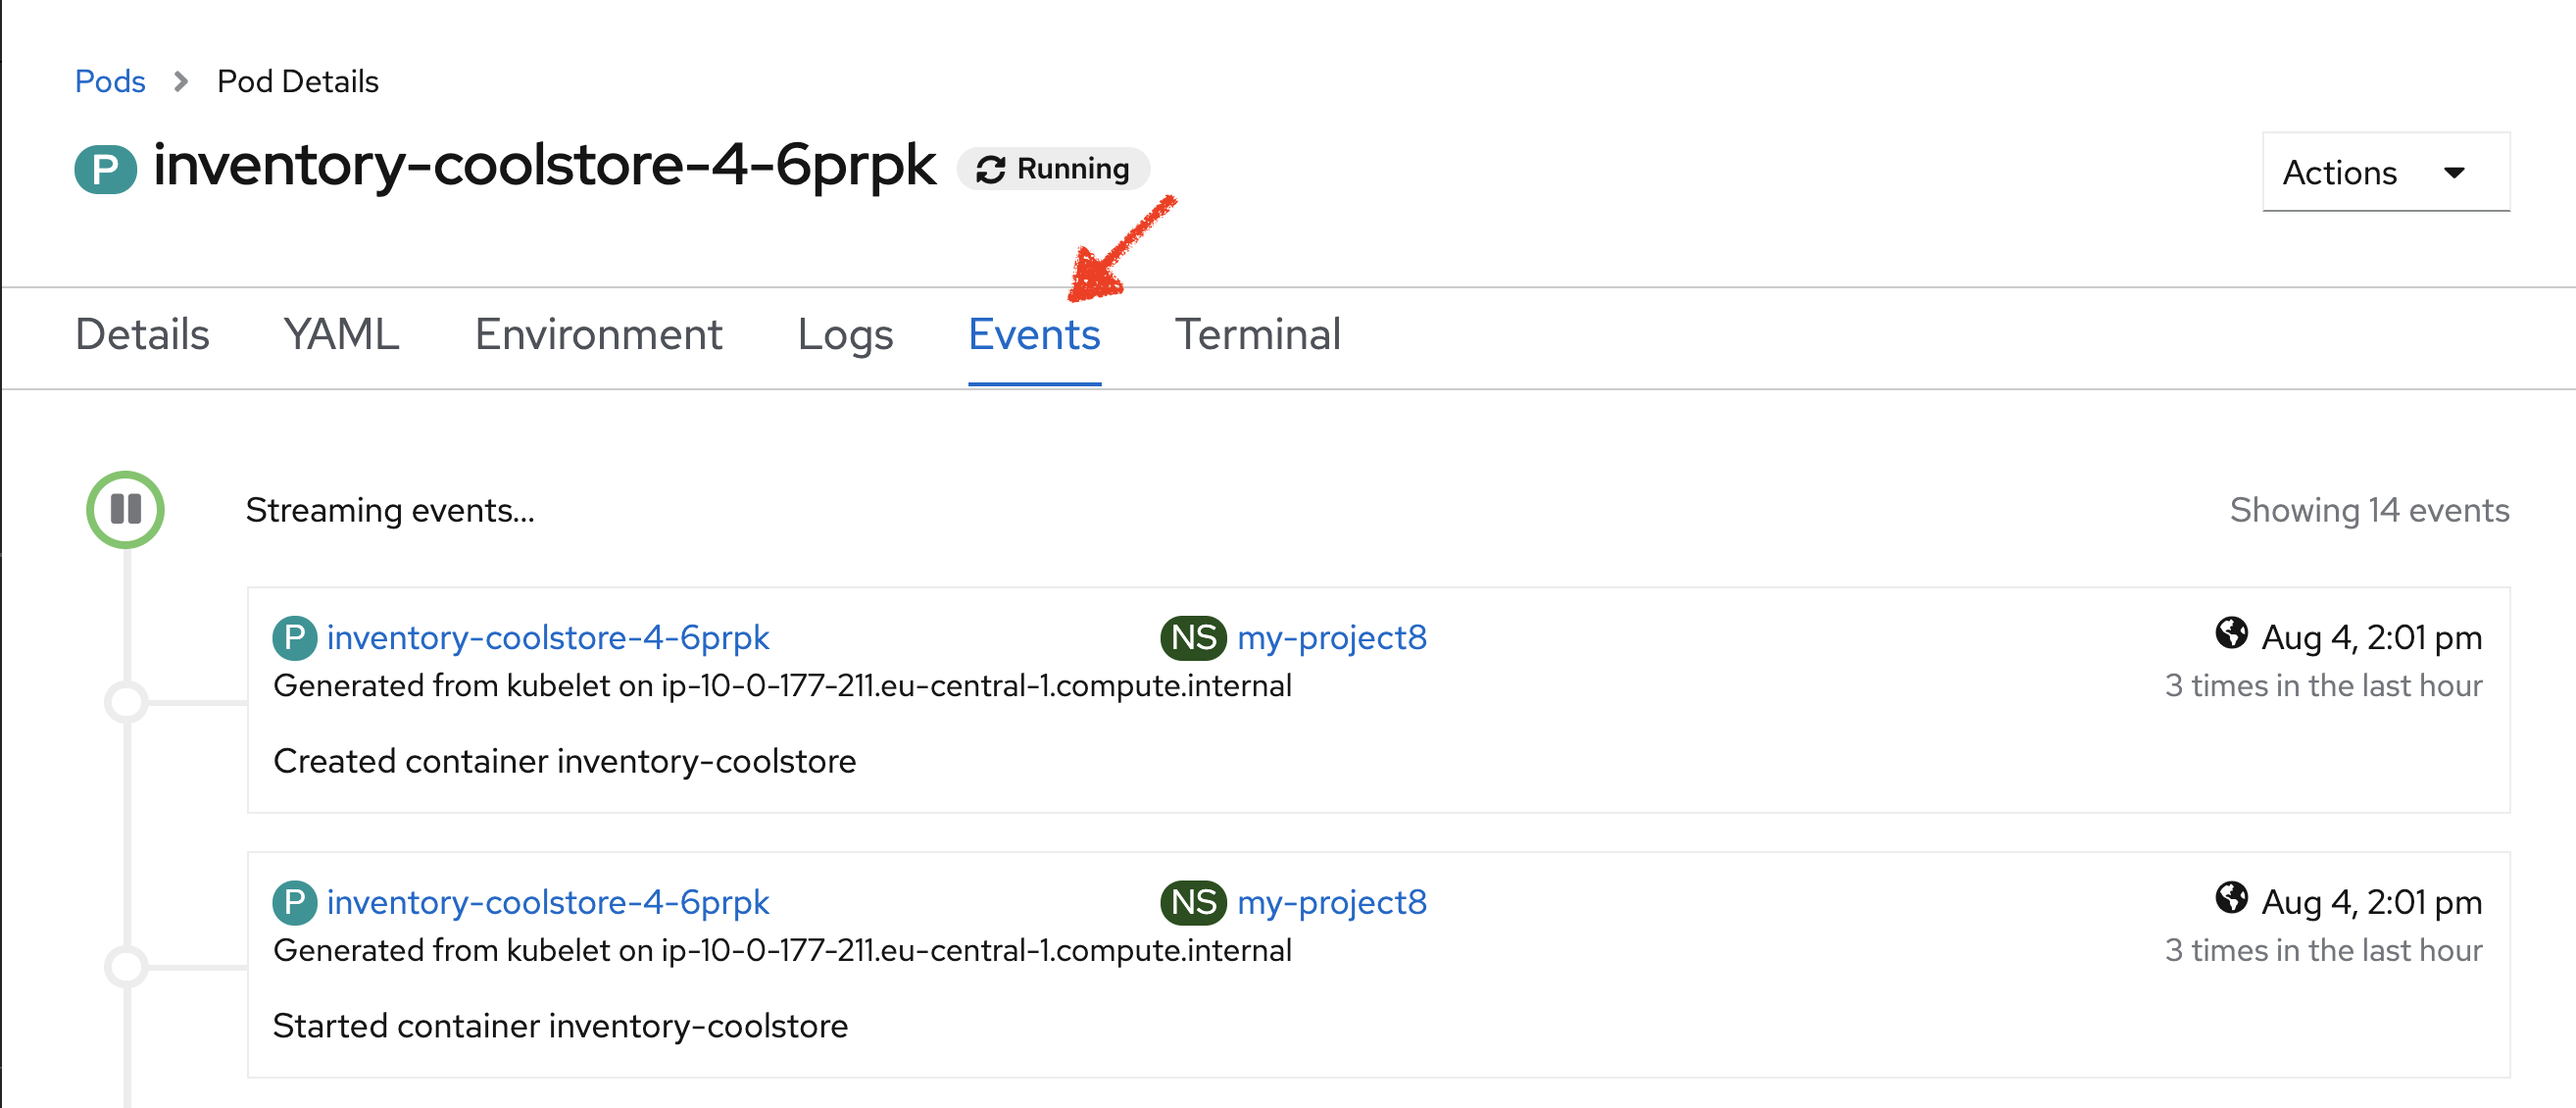
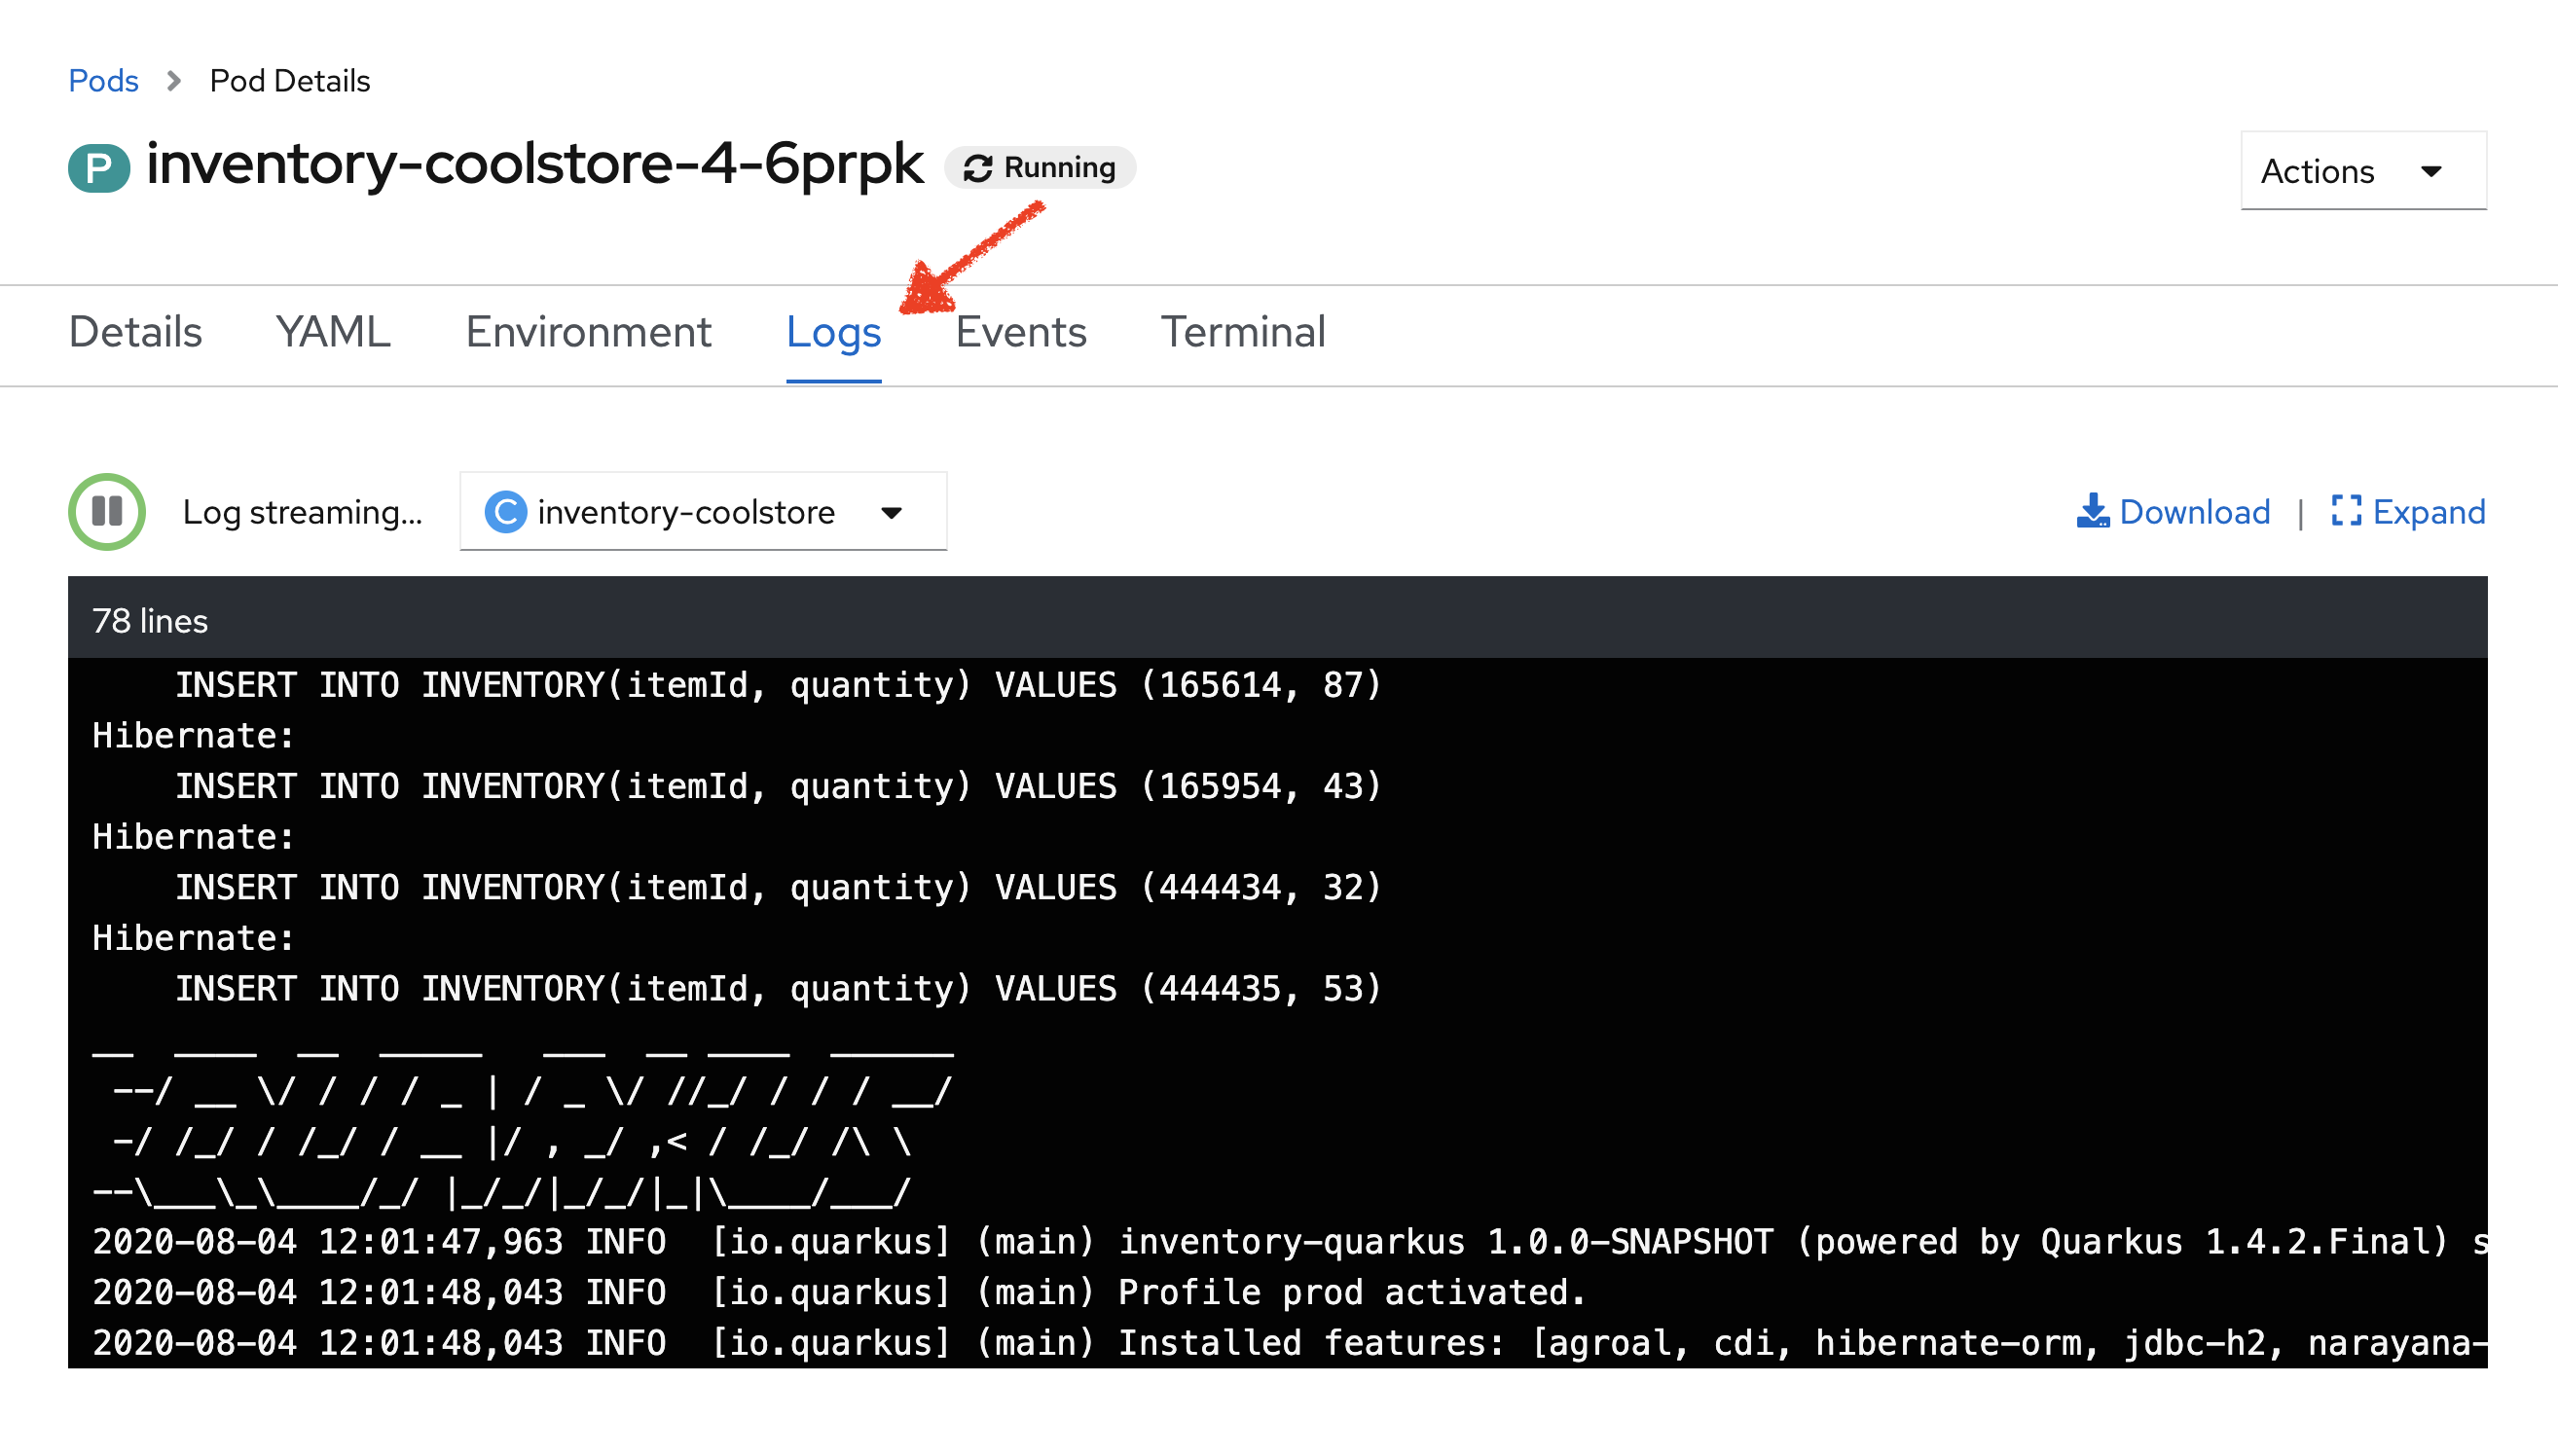
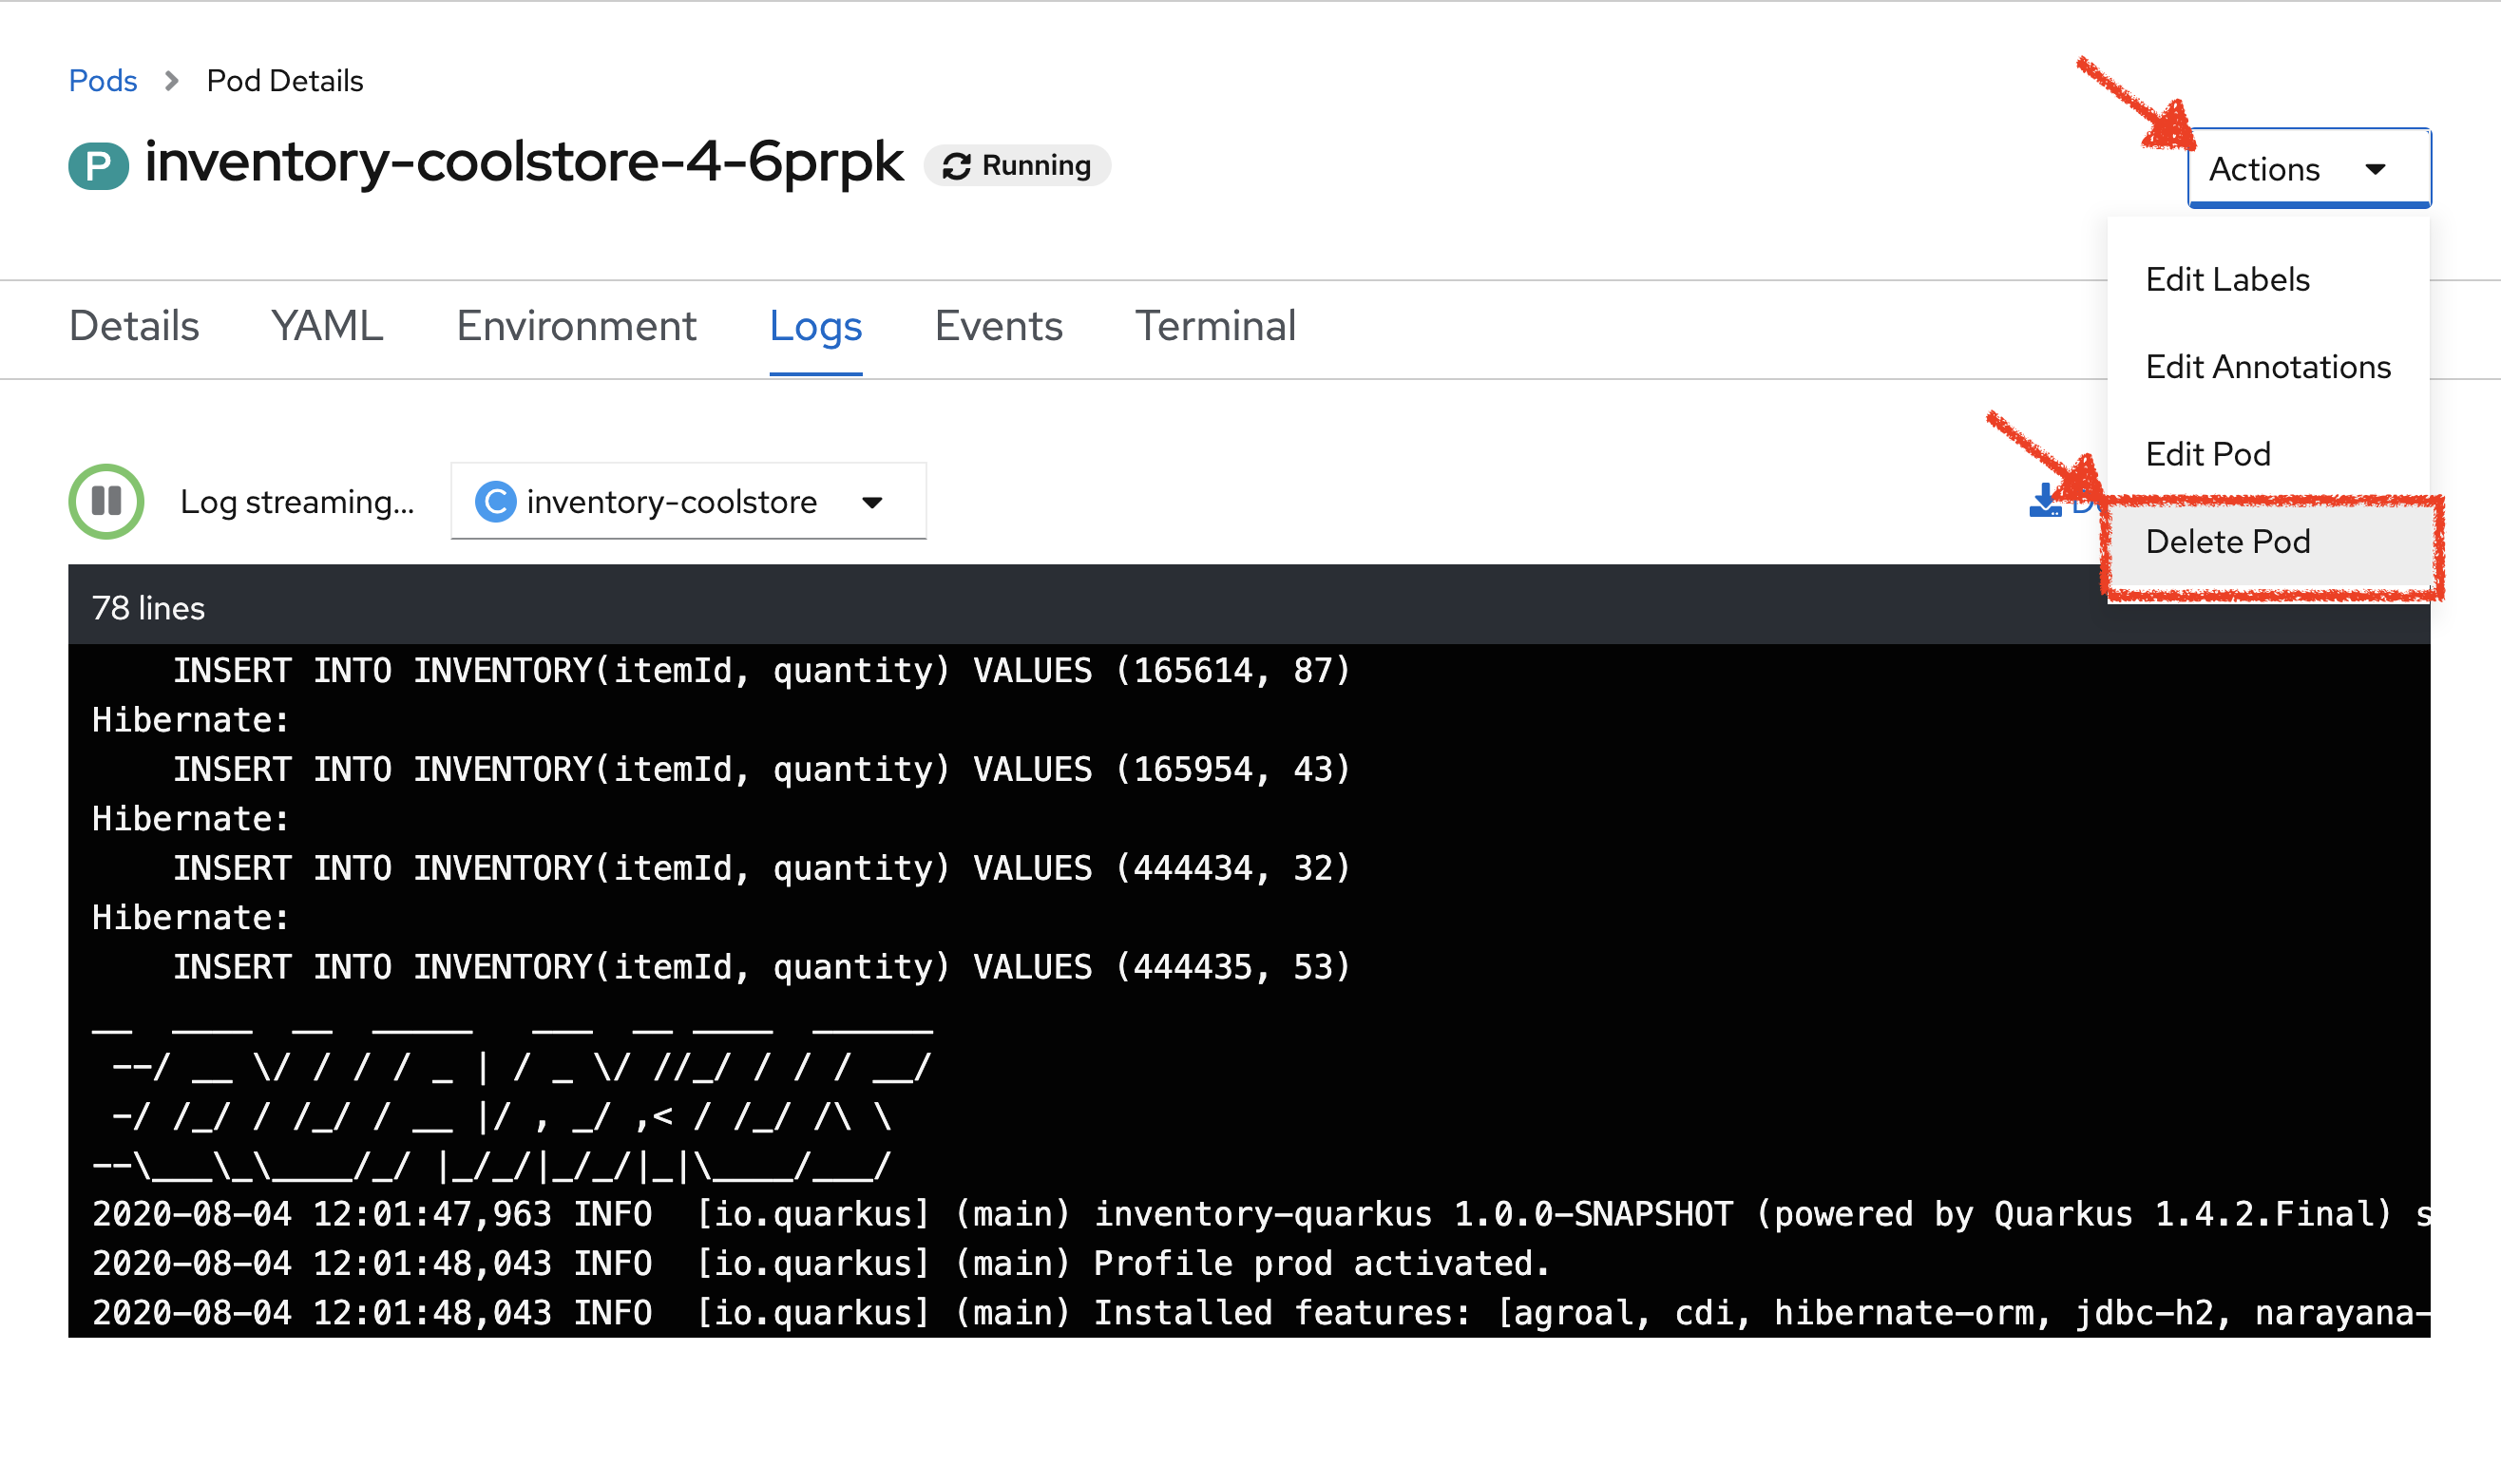
In the OpenShift Web Console, *click on the 'Events' and 'Logs' tabs * and notice that
everything seems to be ok.
Now, try to access your Inventory Service.
You don’t have any response anymore (as the process has been stopped previously).
Often, applications need a restart to work correctly again.
In the OpenShift Web Console, click on 'Actions' → 'Delete Pod' → 'Delete'
A new instance (pod) will be redeployed. Once done, try to access again your Inventory Service.
Now the Inventory Service is working again.
To make your application more robust and reliable, a Liveness check will be used to check if the container itself has become unresponsive. If the liveness probe fails due to a condition such as a deadlock, the container could automatically restart (based on its restart policy).
Configuring Liveness Probes
SmallRye Health is a Quarkus extension which utilizes the MicroProfile Health specification. It allows applications to provide information about their state to external viewers which is typically useful in cloud environments where automated processes must be able to determine whether the application should be discarded or restarted.
Let’s add the needed dependencies to /projects/workshop/labs/inventory-quarkus/pom.xml.
In your Workspace, edit the '/projects/workshop/labs/inventory-quarkus/pom.xml' file:
    <dependency>
      <groupId>io.quarkus</groupId>
      <artifactId>quarkus-smallrye-health</artifactId>
    </dependency>
Then, build and push the updated Inventory Service to the OpenShift cluster.
Once completed, verify that the health endpoint works for the Inventory Service using curl
In your Workspace,
execute the following commands in the terminal window
curl -w "\n" http://inventory-coolstore.my-project%USER_ID%.svc:8080/q/health
To open a terminal window, click on 'Terminal' → 'New Terminal'
|
You should have the following output:
{
"status": "UP",
"checks": [
{
"name": "Database connection(s) health check",
"status": "UP"
}
]
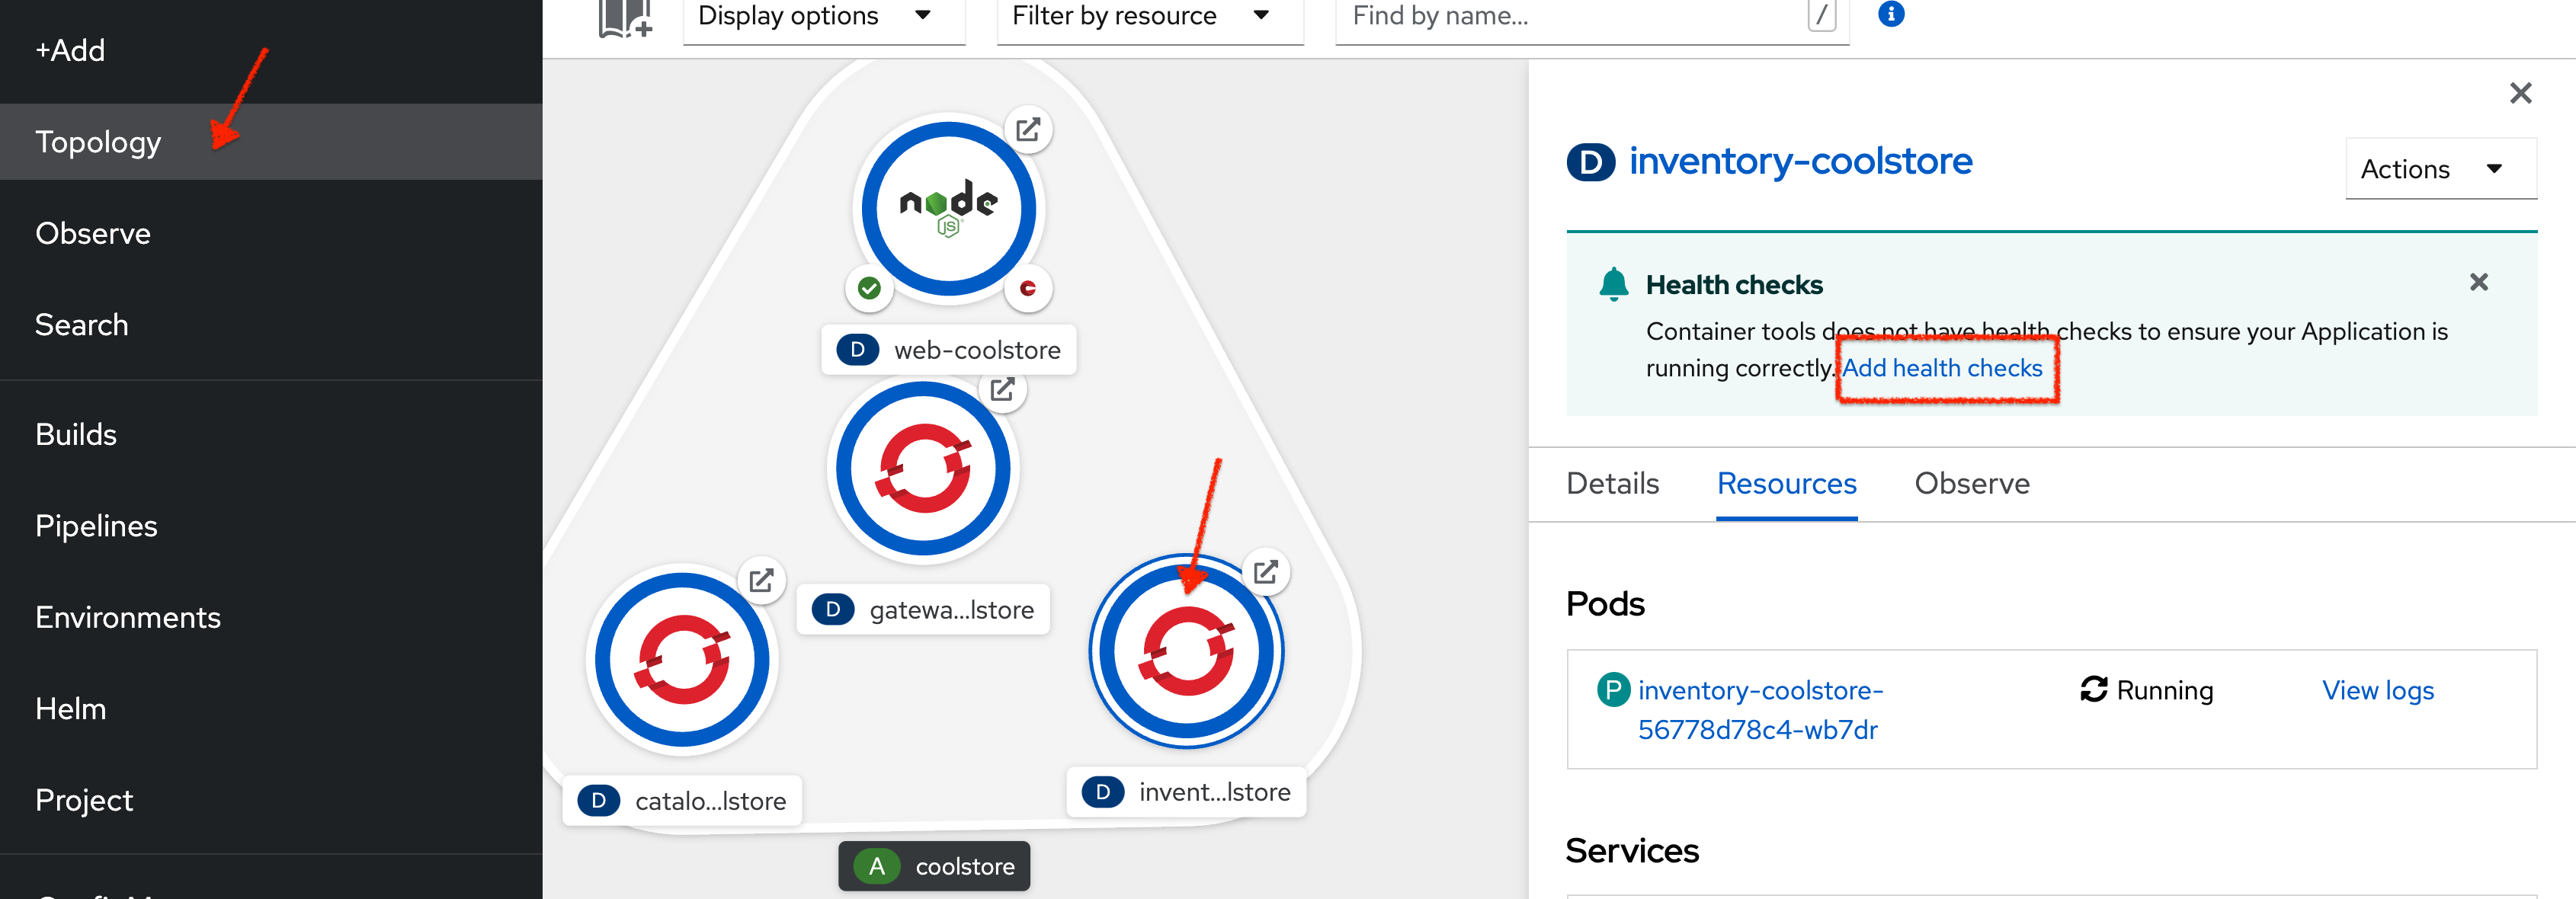
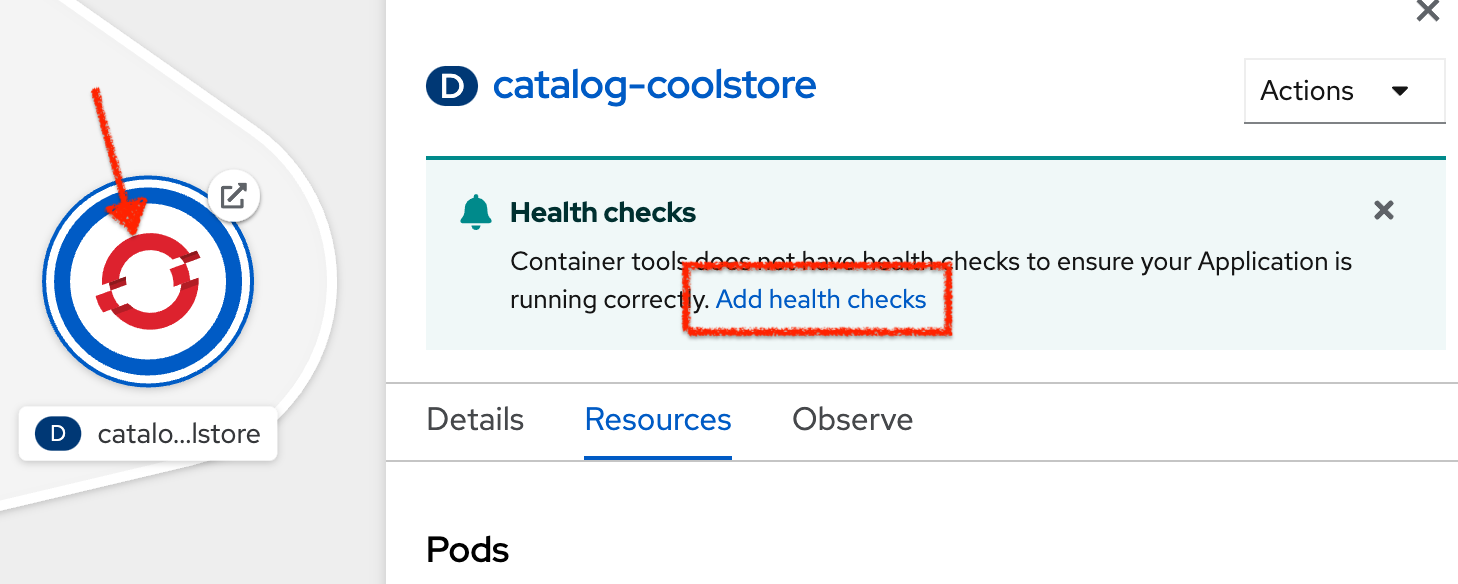
}In the OpenShift Web Console, from the Developer view,
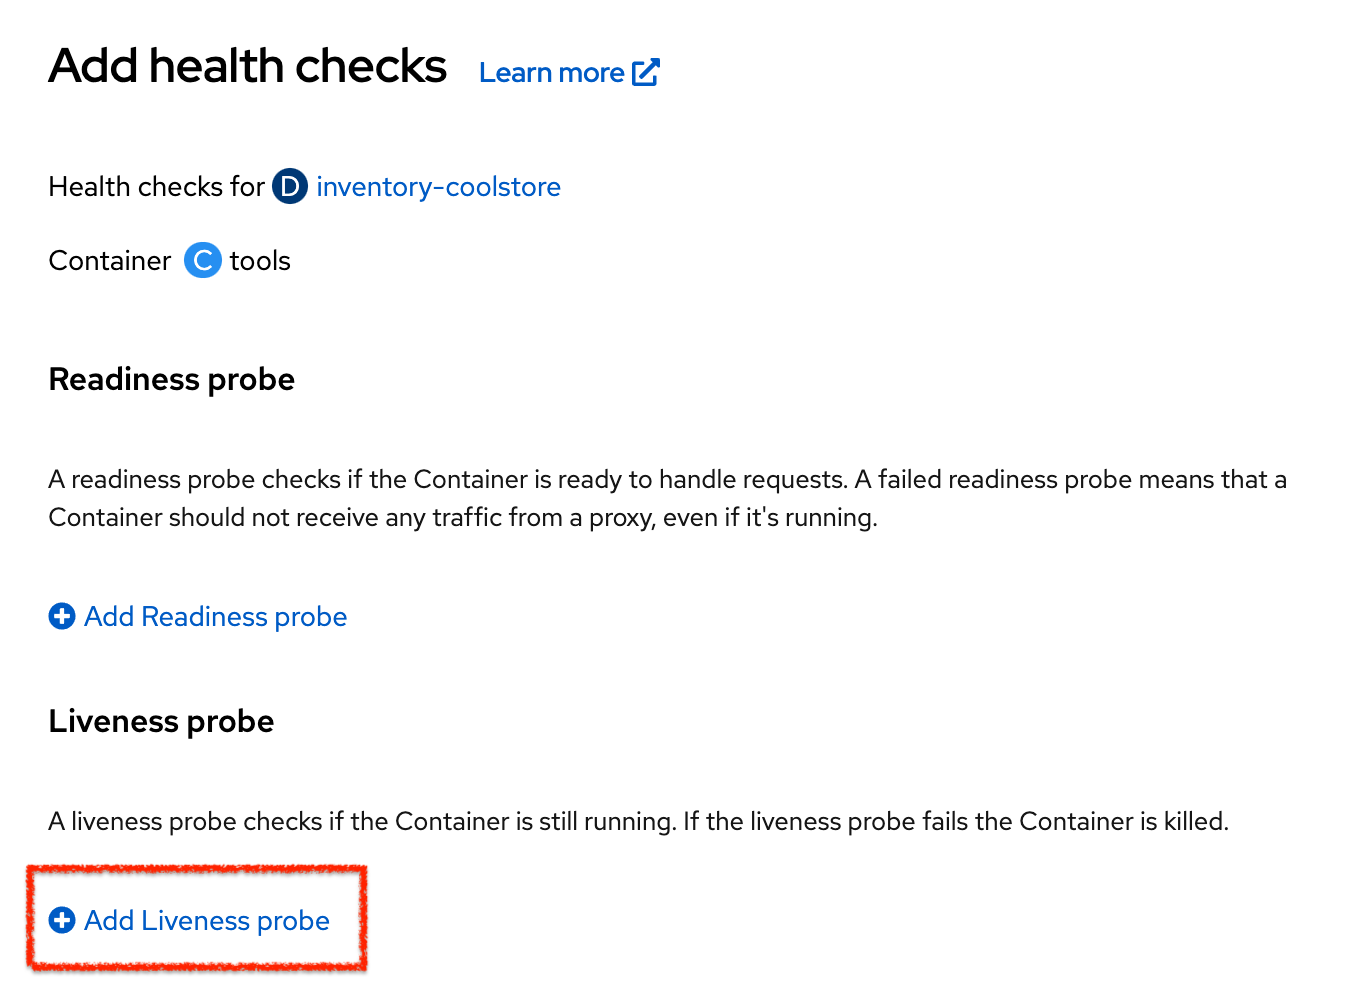
click on 'Topology' → '(D) inventory-coolstore' → 'Add Health Checks'.
Then click on 'Add Liveness Probe'
Enter the following information:
| Parameter | Value |
|---|---|
Type |
HTTP GET |
Use HTTPS |
Unchecked |
HTTP Headers |
Empty |
Path |
/q/health/live |
Port |
8080 |
Failure Threshold |
3 |
Success Threshold |
1 |
Initial Delay |
10 |
Period |
10 |
Timeout |
1 |
Finally click on the check icon and the 'Add' button. OpenShift automates deployments using
deployment triggers
that react to changes to the container image or configuration.
Therefore, as soon as you define the probe, OpenShift automatically redeploys the pod using the new configuration including the liveness probe.
Testing Liveness Probes
As you did previously, in the OpenShift Web Console, from the Developer view,
access into the container and suspend the Inventory Service java process.
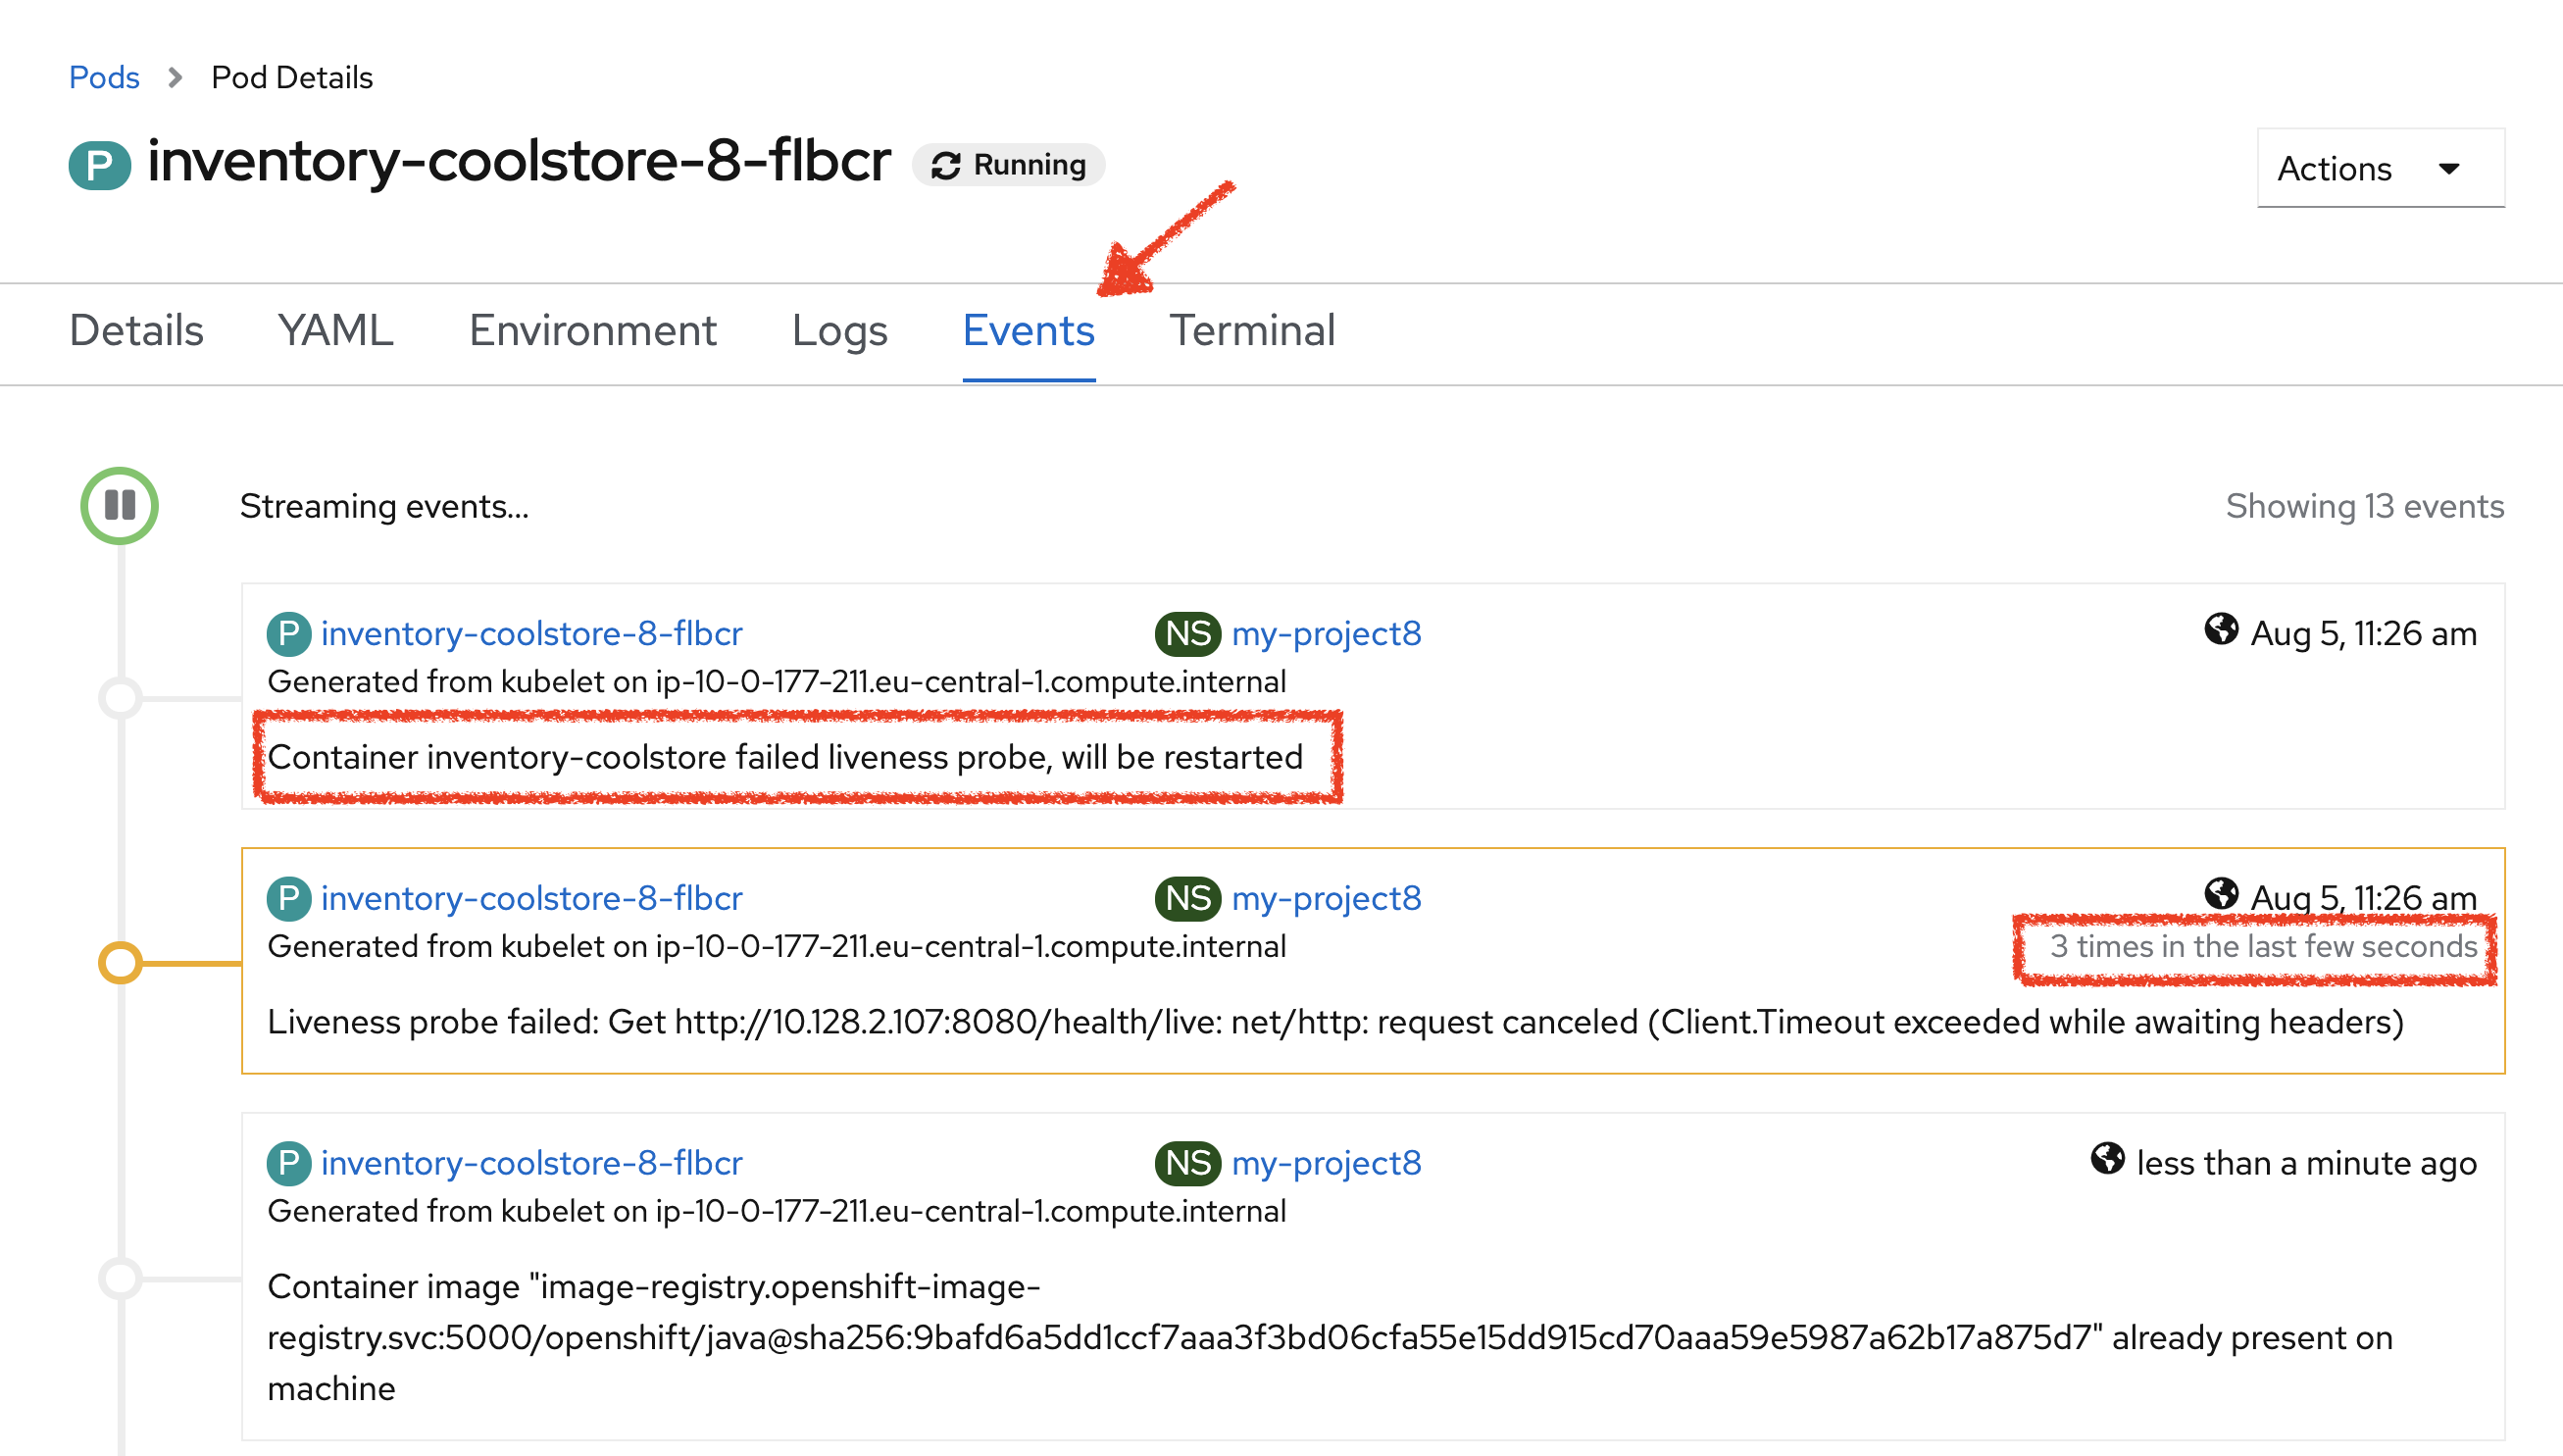
Then, still in the OpenShift Web Console, click on the 'Events' tab.
After 3 failed checks, OpenShift automatically restarts the container.
Now, access to your Inventory Service.
The service is up and running again.
Understanding Readiness Probes
What happens if you DON’T setup Readiness checks?
Let’s imagine you have traffic to the Catalog Service
In your Workspace,
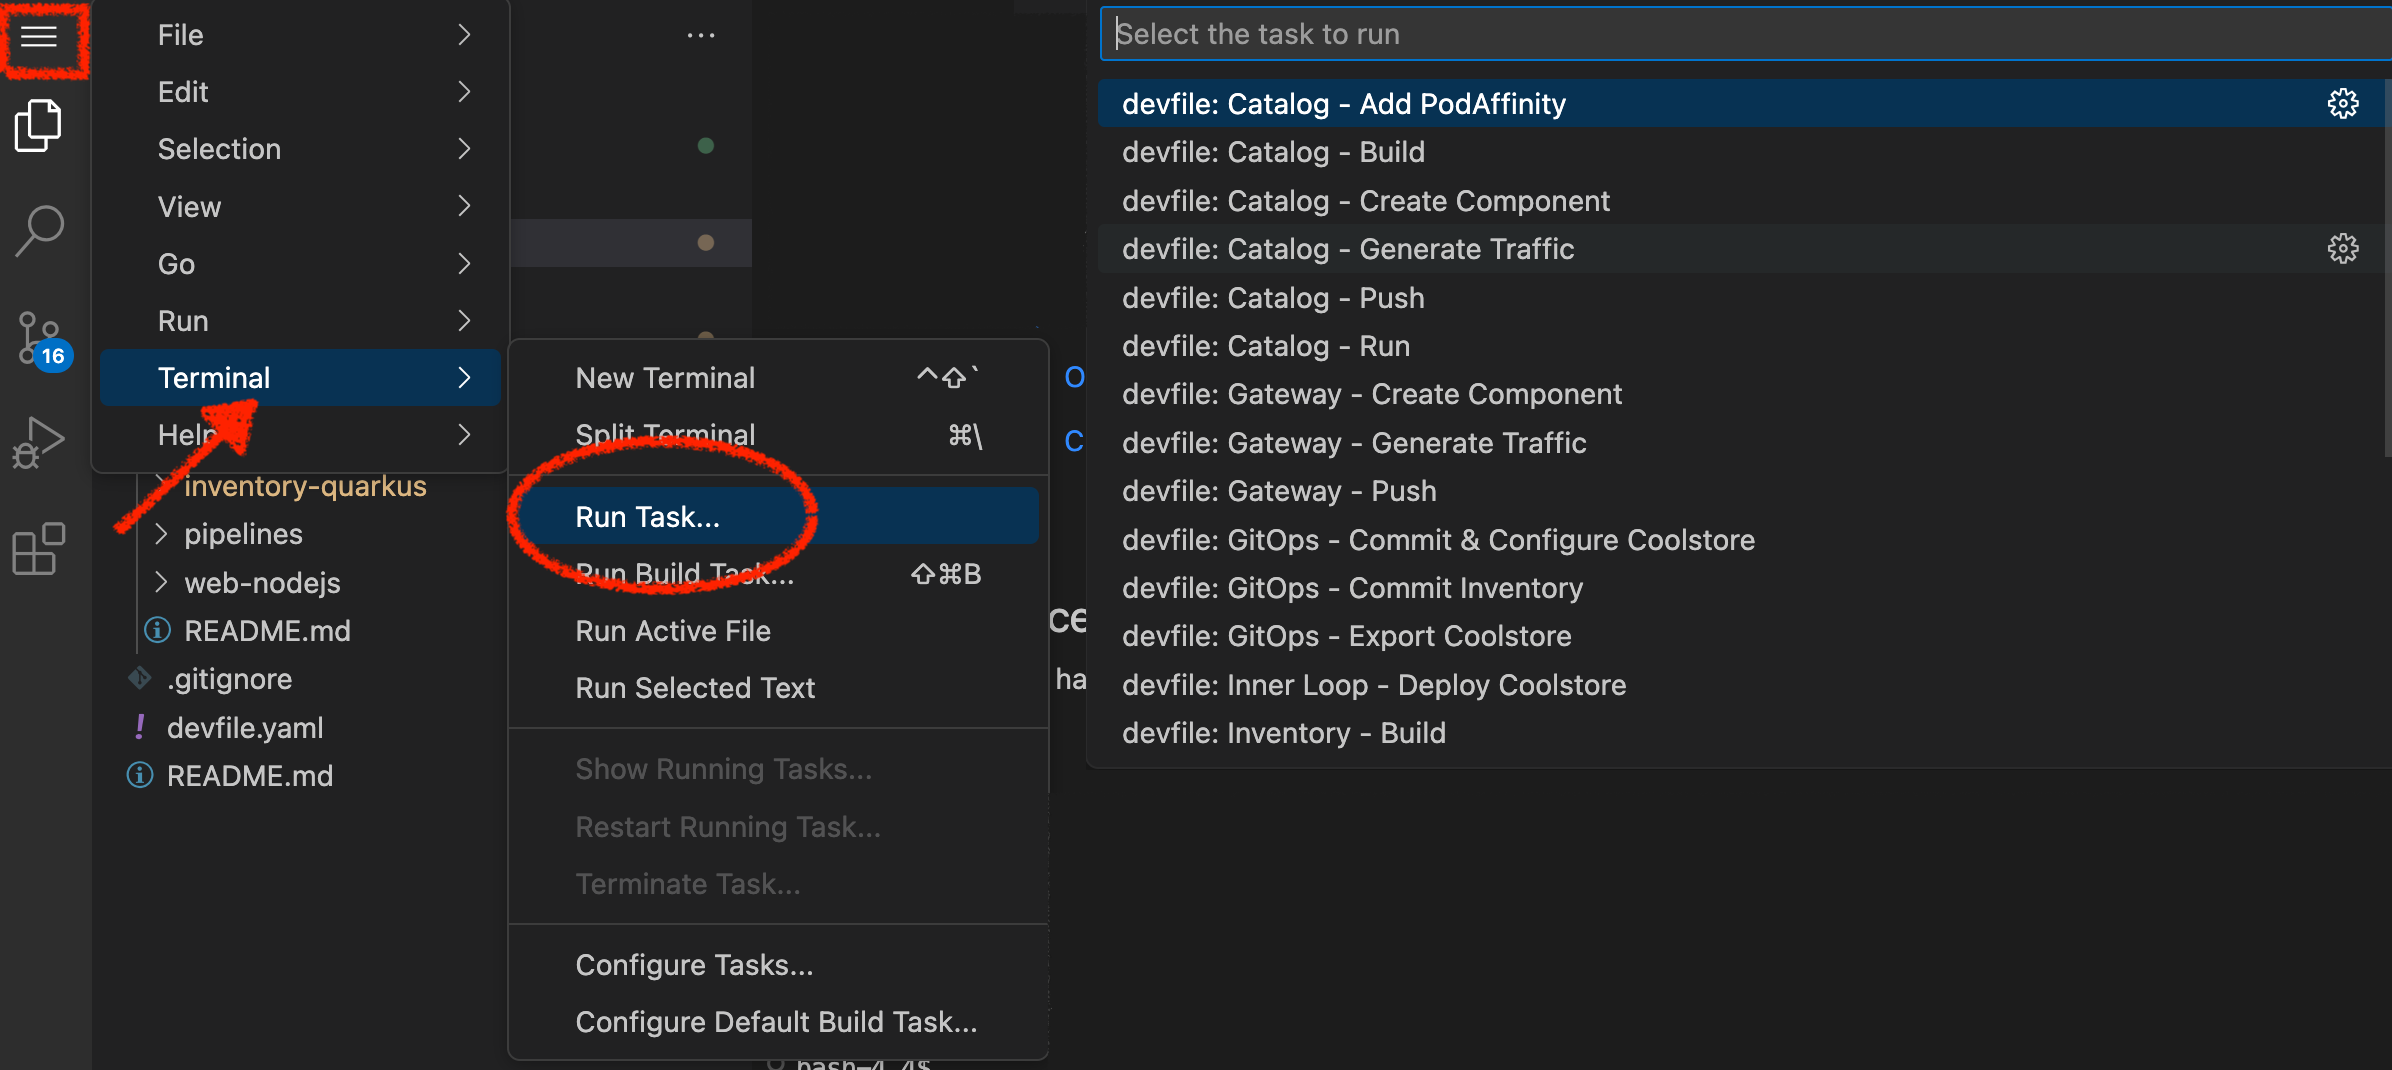
Click on 'Terminal' → 'Run Task…' → 'devfile: Catalog - Generate Traffic'
Execute the following commands in the terminal window
for i in {1..60}
do
    if [ $(curl -s -w "%{http_code}" -o /dev/null http://catalog-coolstore.my-project%USER_ID%.svc:8080/actuator/health) == "200" ]
    then
        MSG="\033[0;32mThe request to Catalog Service has succeeded\033[0m"
    else
        MSG="\033[0;31mERROR - The request to Catalog Service has failed\033[0m"
    fi

    echo -e $MSG
    sleep 2s
done
To open a terminal window, click on 'Terminal' → 'New Terminal'
|
You should have the following output:
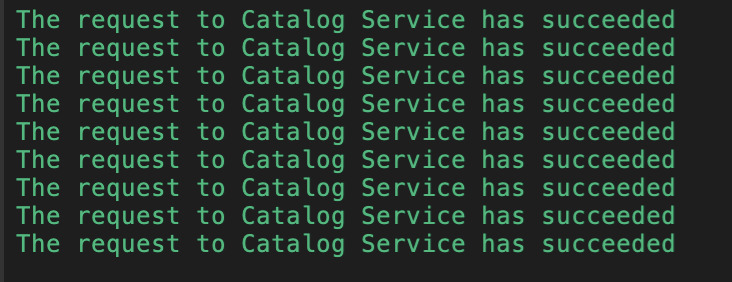
Now let’s scale out your Catalog Service to 2 instances.
In the OpenShift Web Console, from the Developer view,
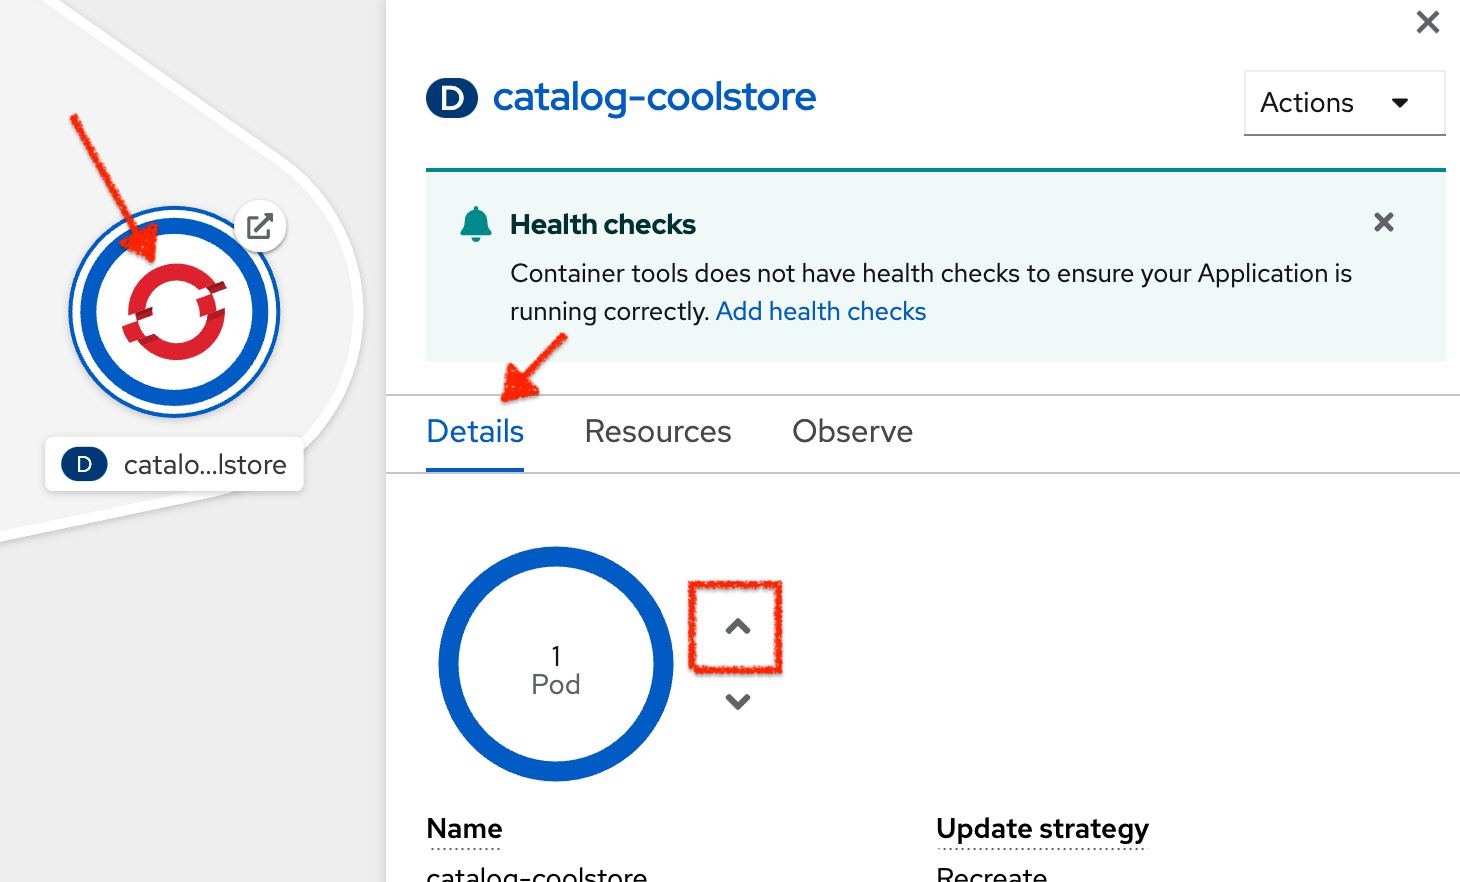
click on 'Topology' → '(D) catalog-coolstore' → 'Details' then click once on the up arrows
on the right side of the pod blue circle
.
|
Only if you get an error when scaling out the Catalog Service. Otherwise, please skip this warning section. Indeed, odo sets up its mechanisms with a ReadWriteOnce (RWO) Persistent Volume. It means only one node could read/write this volume at a time. However, it may happen the new instances of the Catalog Service will not be located in the same node. To avoid that, you need to add a PodAffinity configuration to ensure that all the instances of the Catalog Service will always be co-located in the same node. In your Workspace,
|
You should see the 2 instances (pods) running.
Now, switch back to your Workspace and check the output of the 'Catalog Generate Traffic' task.
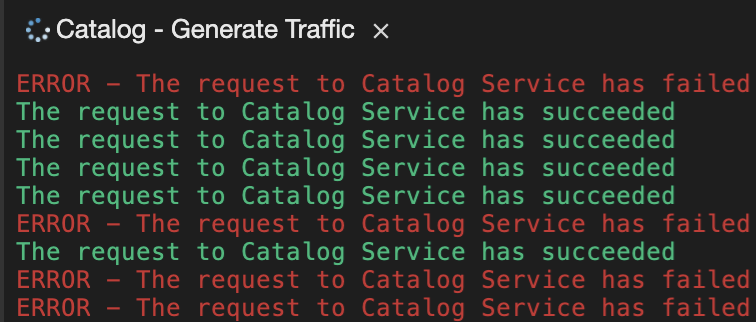
Why do some requests failed? Because as soon as the container is created, the traffic is sent to this new instance even if the application is not ready. (The Catalog Service takes more than 20 seconds to start up).
In order to prevent this behaviour, a Readiness check is needed. It determines if the container in which it is scheduled is ready to service requests. If the readiness probe fails a container, the endpoints controller ensures the container has its IP address removed from the endpoints of all services. A readiness probe can be used to signal to the endpoints controller that even though a container is running, it should not receive any traffic from a proxy.
Configuring Readiness Probes
First, scale down your Catalog Service to 1 instance. In the OpenShift Web Console, from the Developer view,
click on 'Topology' → '(D) catalog-coolstore' → 'Details' then click once on the down arrows
on the right side of the pod blue circle
.
Spring Boot Actuator is a sub-project of Spring Boot which adds health and management HTTP endpoints to the application. Enabling Spring Boot Actuator is done via adding org.springframework.boot:spring-boot-starter-actuator dependency to the Maven project dependencies which is already done for the Catalog Service.
Verify that the health endpoint works for the Catalog Service using curl.
In your Workspace, in the terminal window,
execute the following commands:
curl -w "\n" http://catalog-coolstore.my-project%USER_ID%.svc:8080/actuator/healthYou should have the following output:
{"status":"UP"}In the OpenShift Web Console, from the Developer view,
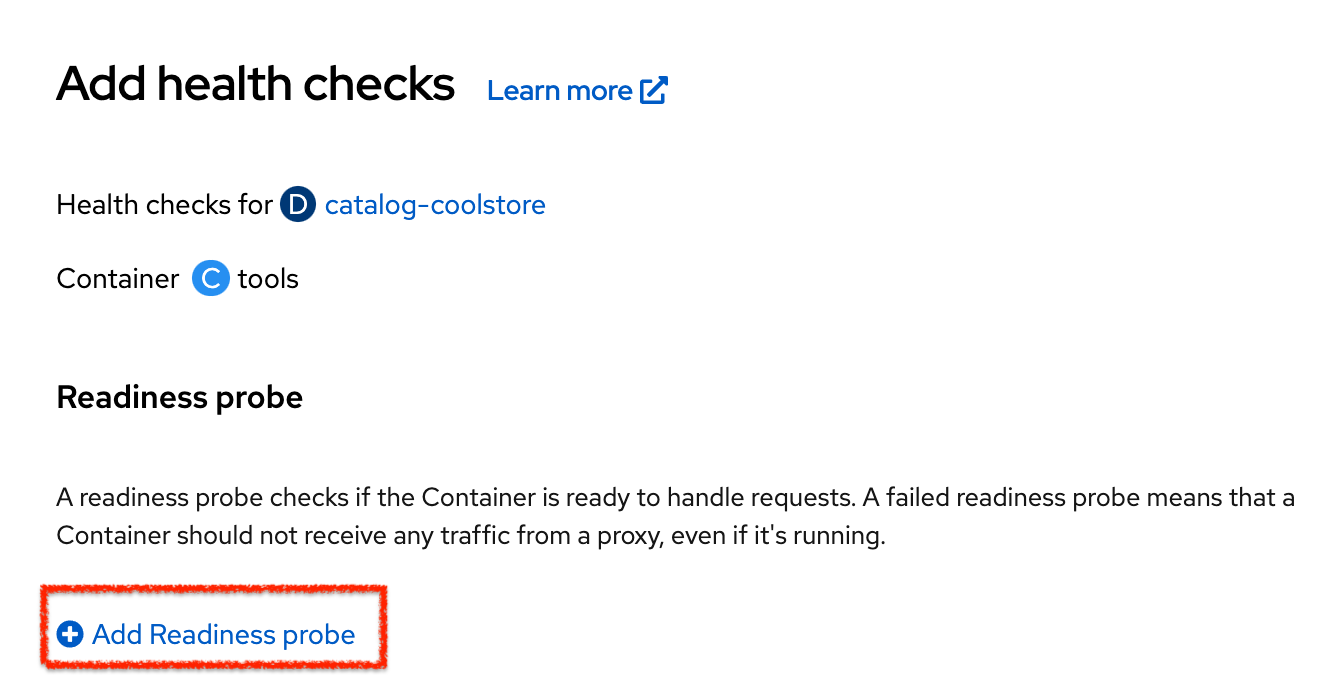
click on 'Topology' → '(D) catalog-coolstore' → 'Add Health Checks'.
Then click on 'Add Readiness Probe'
Enter the following information:
| Parameter | Value |
|---|---|
Type |
HTTP GET |
Use HTTPS |
Unchecked |
HTTP Headers |
Empty |
Path |
/actuator/health |
Port |
8080 |
Failure Threshold |
3 |
Success Threshold |
1 |
Initial Delay |
0 |
Period |
10 |
Timeout |
1 |
Finally click on the check icon and the 'Add' button. The Readiness check is now set up.
Testing Readiness Probes
Now let’s test it as you did previously.
Generate traffic to Catalog Service and then, in the OpenShift Web Console,
scale out the Catalog Service to 2 instances (pods)
In your Workspace, check the output of the 'Catalog Generate Traffic' task.
You should not see any error means that you can now scale out your Catalog Service with no downtime.
Now scale down your Catalog Service to 1 instance. In the OpenShift Web Console, from the Developer view,
click on 'Topology' → '(D) catalog-coolstore' → 'Details' then click once on the down arrows
on the right side of the pod blue circle
.
Understanding Startup Probes
Startup probes are similar to liveness probes but only executed at startup. When a startup probe is configured, the other probes are disabled until it suceeds.
Sometimes, some (legacy) applications might need extra times for their first initialization. In such cases, setting a longer liveness internal might compromise the main benefit of this probe ie providing the fast response to stuck states.
Startup probes are useful to cover this worse case startup time.
Monitoring All Application Healths
Now you understand and know how to configure Readiness, Liveness and Startup probes, let’s confirm your expertise!
Configure the remaining Probes to for Inventory and Catalog Probes using the following information:
| Inventory Service | Readiness | Startup |
|---|---|---|
Type |
HTTP GET |
HTTP GET |
Use HTTPS |
Unchecked |
Unchecked |
HTTP Headers |
Empty |
Empty |
Path |
/q/health/ready |
/q/health/live |
Port |
8080 |
8080 |
Failure Threshold |
3 |
3 |
Success Threshold |
1 |
1 |
Initial Delay |
0 |
0 |
Period |
5 |
5 |
Timeout |
1 |
1 |
| Catalog Service | Liveness | Startup |
|---|---|---|
Type |
HTTP GET |
HTTP GET |
Use HTTPS |
Unchecked |
Unchecked |
HTTP Headers |
Empty |
Empty |
Path |
/actuator/health |
/actuator/health |
Port |
8080 |
8080 |
Failure Threshold |
3 |
15 |
Success Threshold |
1 |
1 |
Initial Delay |
0 |
0 |
Period |
5 |
10 |
Timeout |
1 |
1 |
Finally, let’s configure probes for Gateway and Web Service.
In your Workspace, click on 'Terminal' → 'Run Task…' → 'devfile: Probes - Configure Gateway & Web'
Monitoring Applications Metrics
Metrics are another important aspect of monitoring applications which is required in order to gain visibility into how the application behaves and particularly in identifying issues.
OpenShift provides container metrics out-of-the-box and displays how much memory, cpu and network each container has been consuming over time.
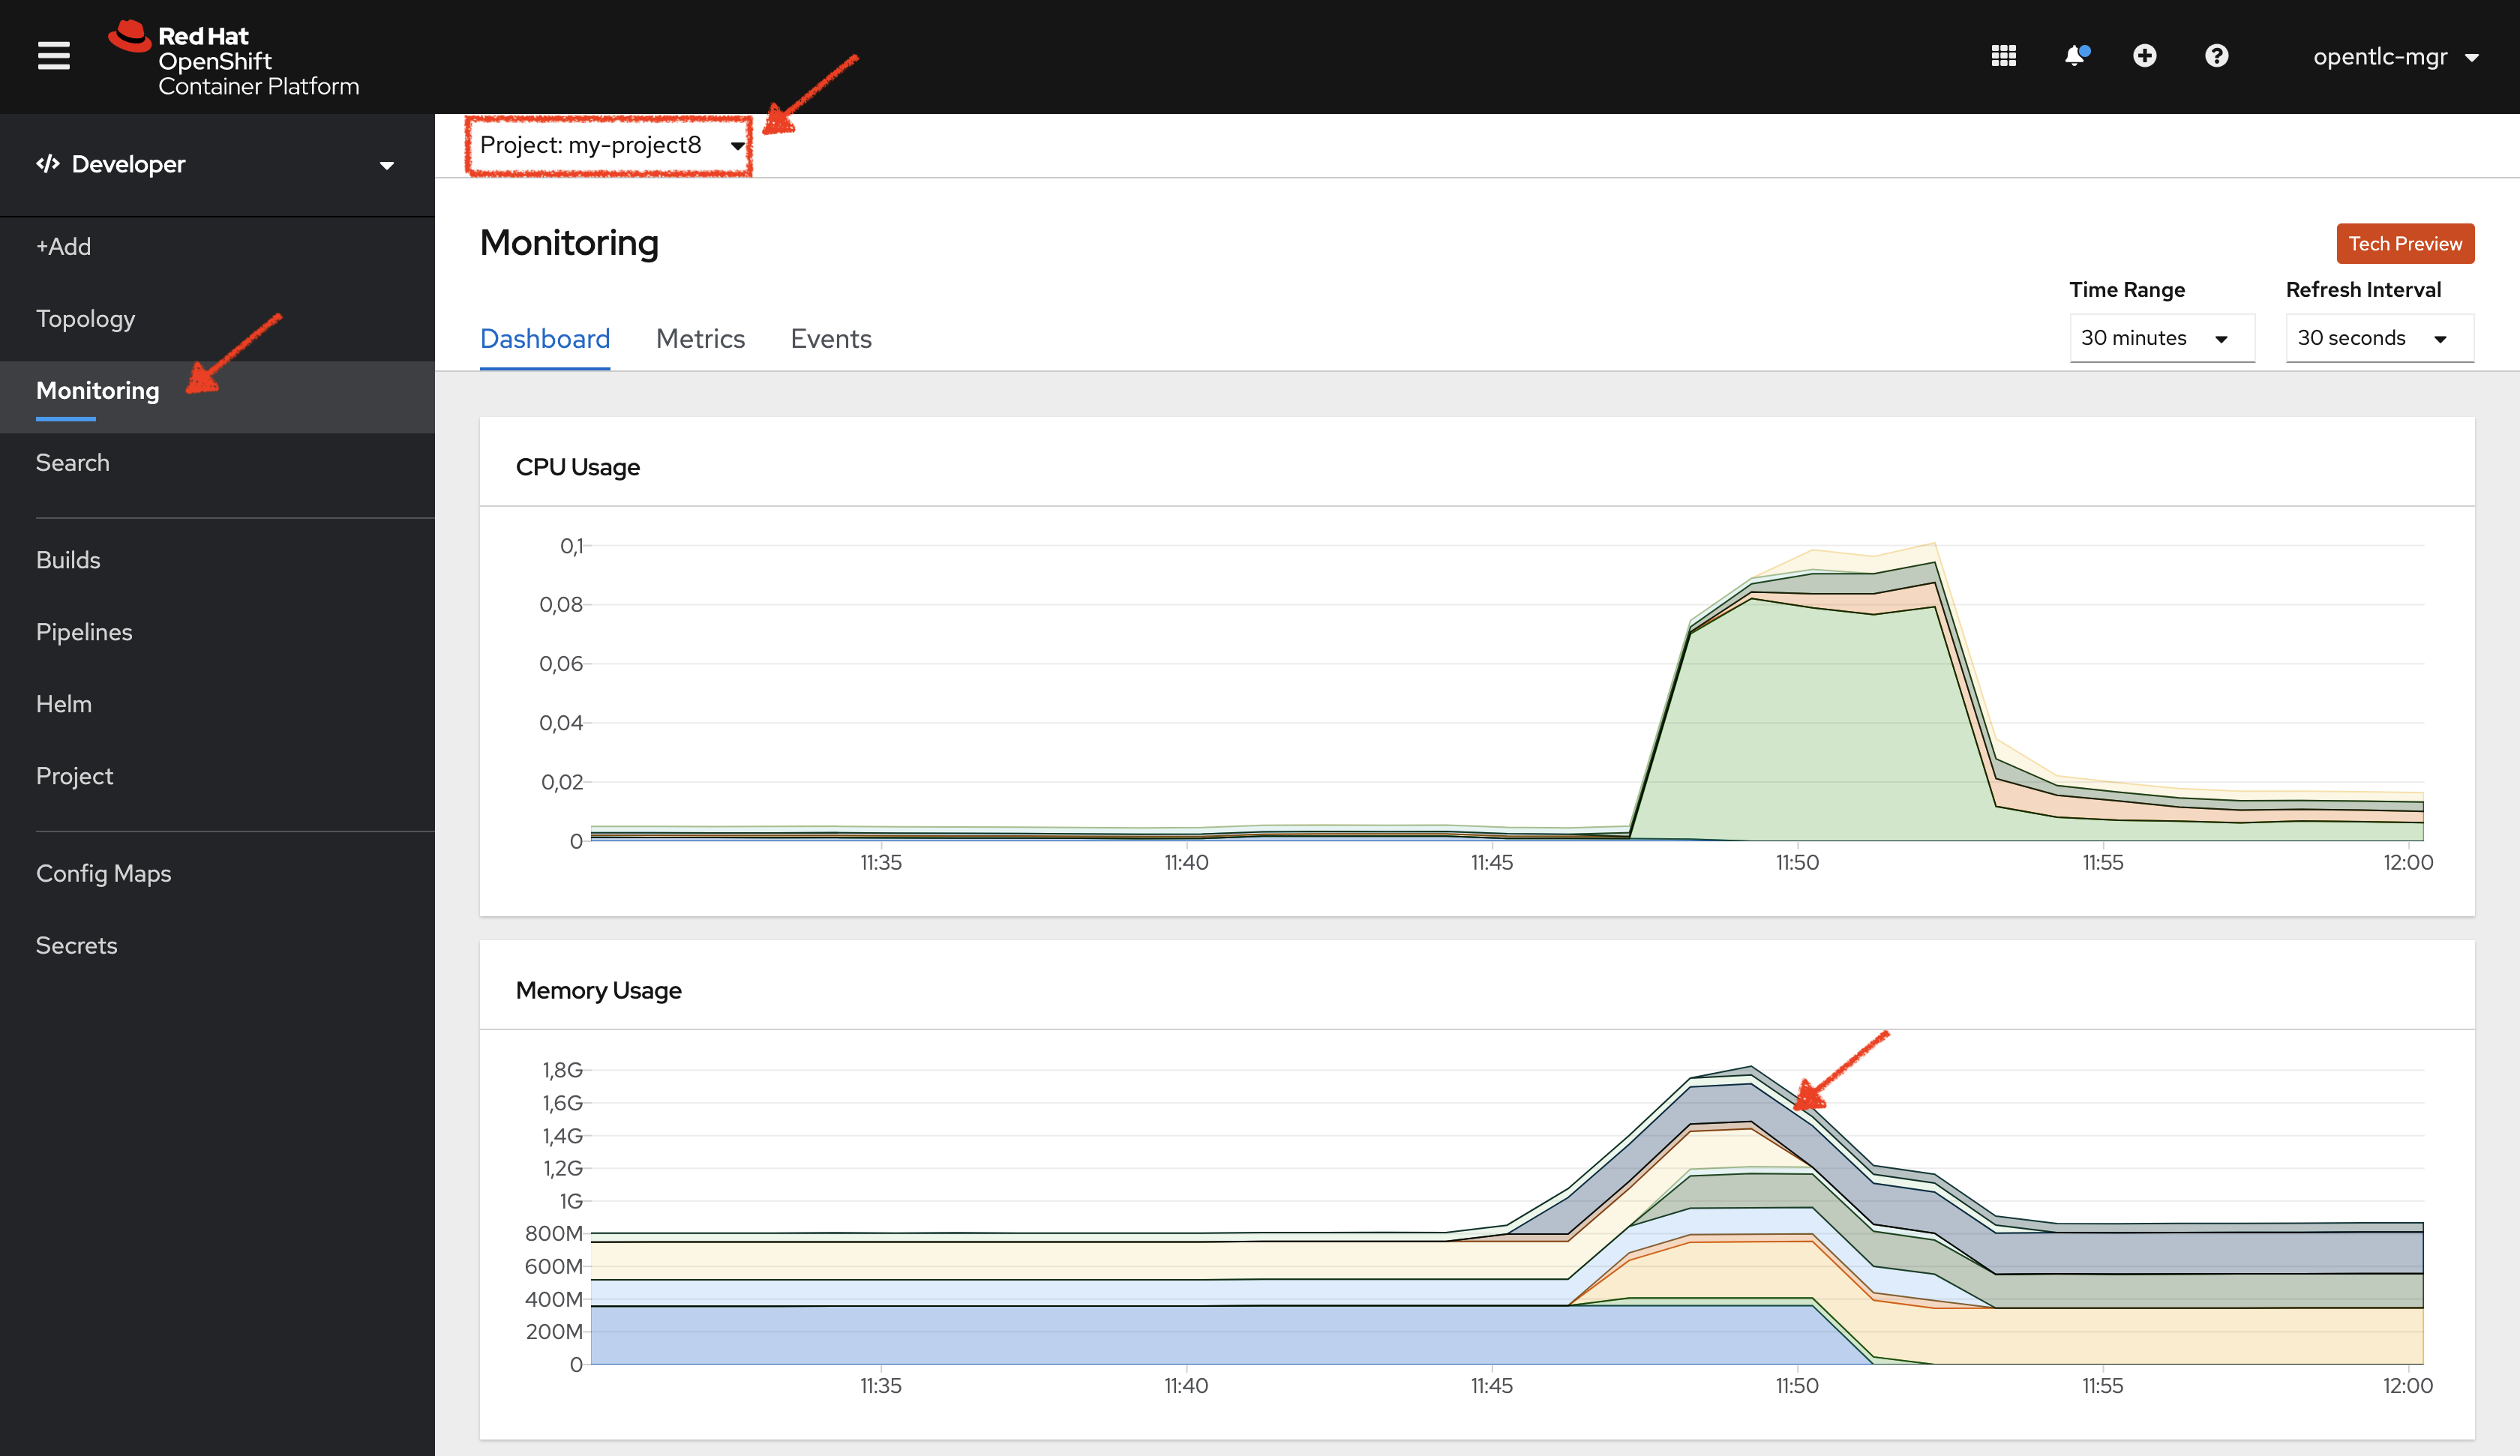
In the OpenShift Web Console, from the Developer view,
click on 'Observe' then select your 'my-project%USER_ID%' project.
In the project overview, you can see the different Resource Usage sections.
click on one graph to get more details.
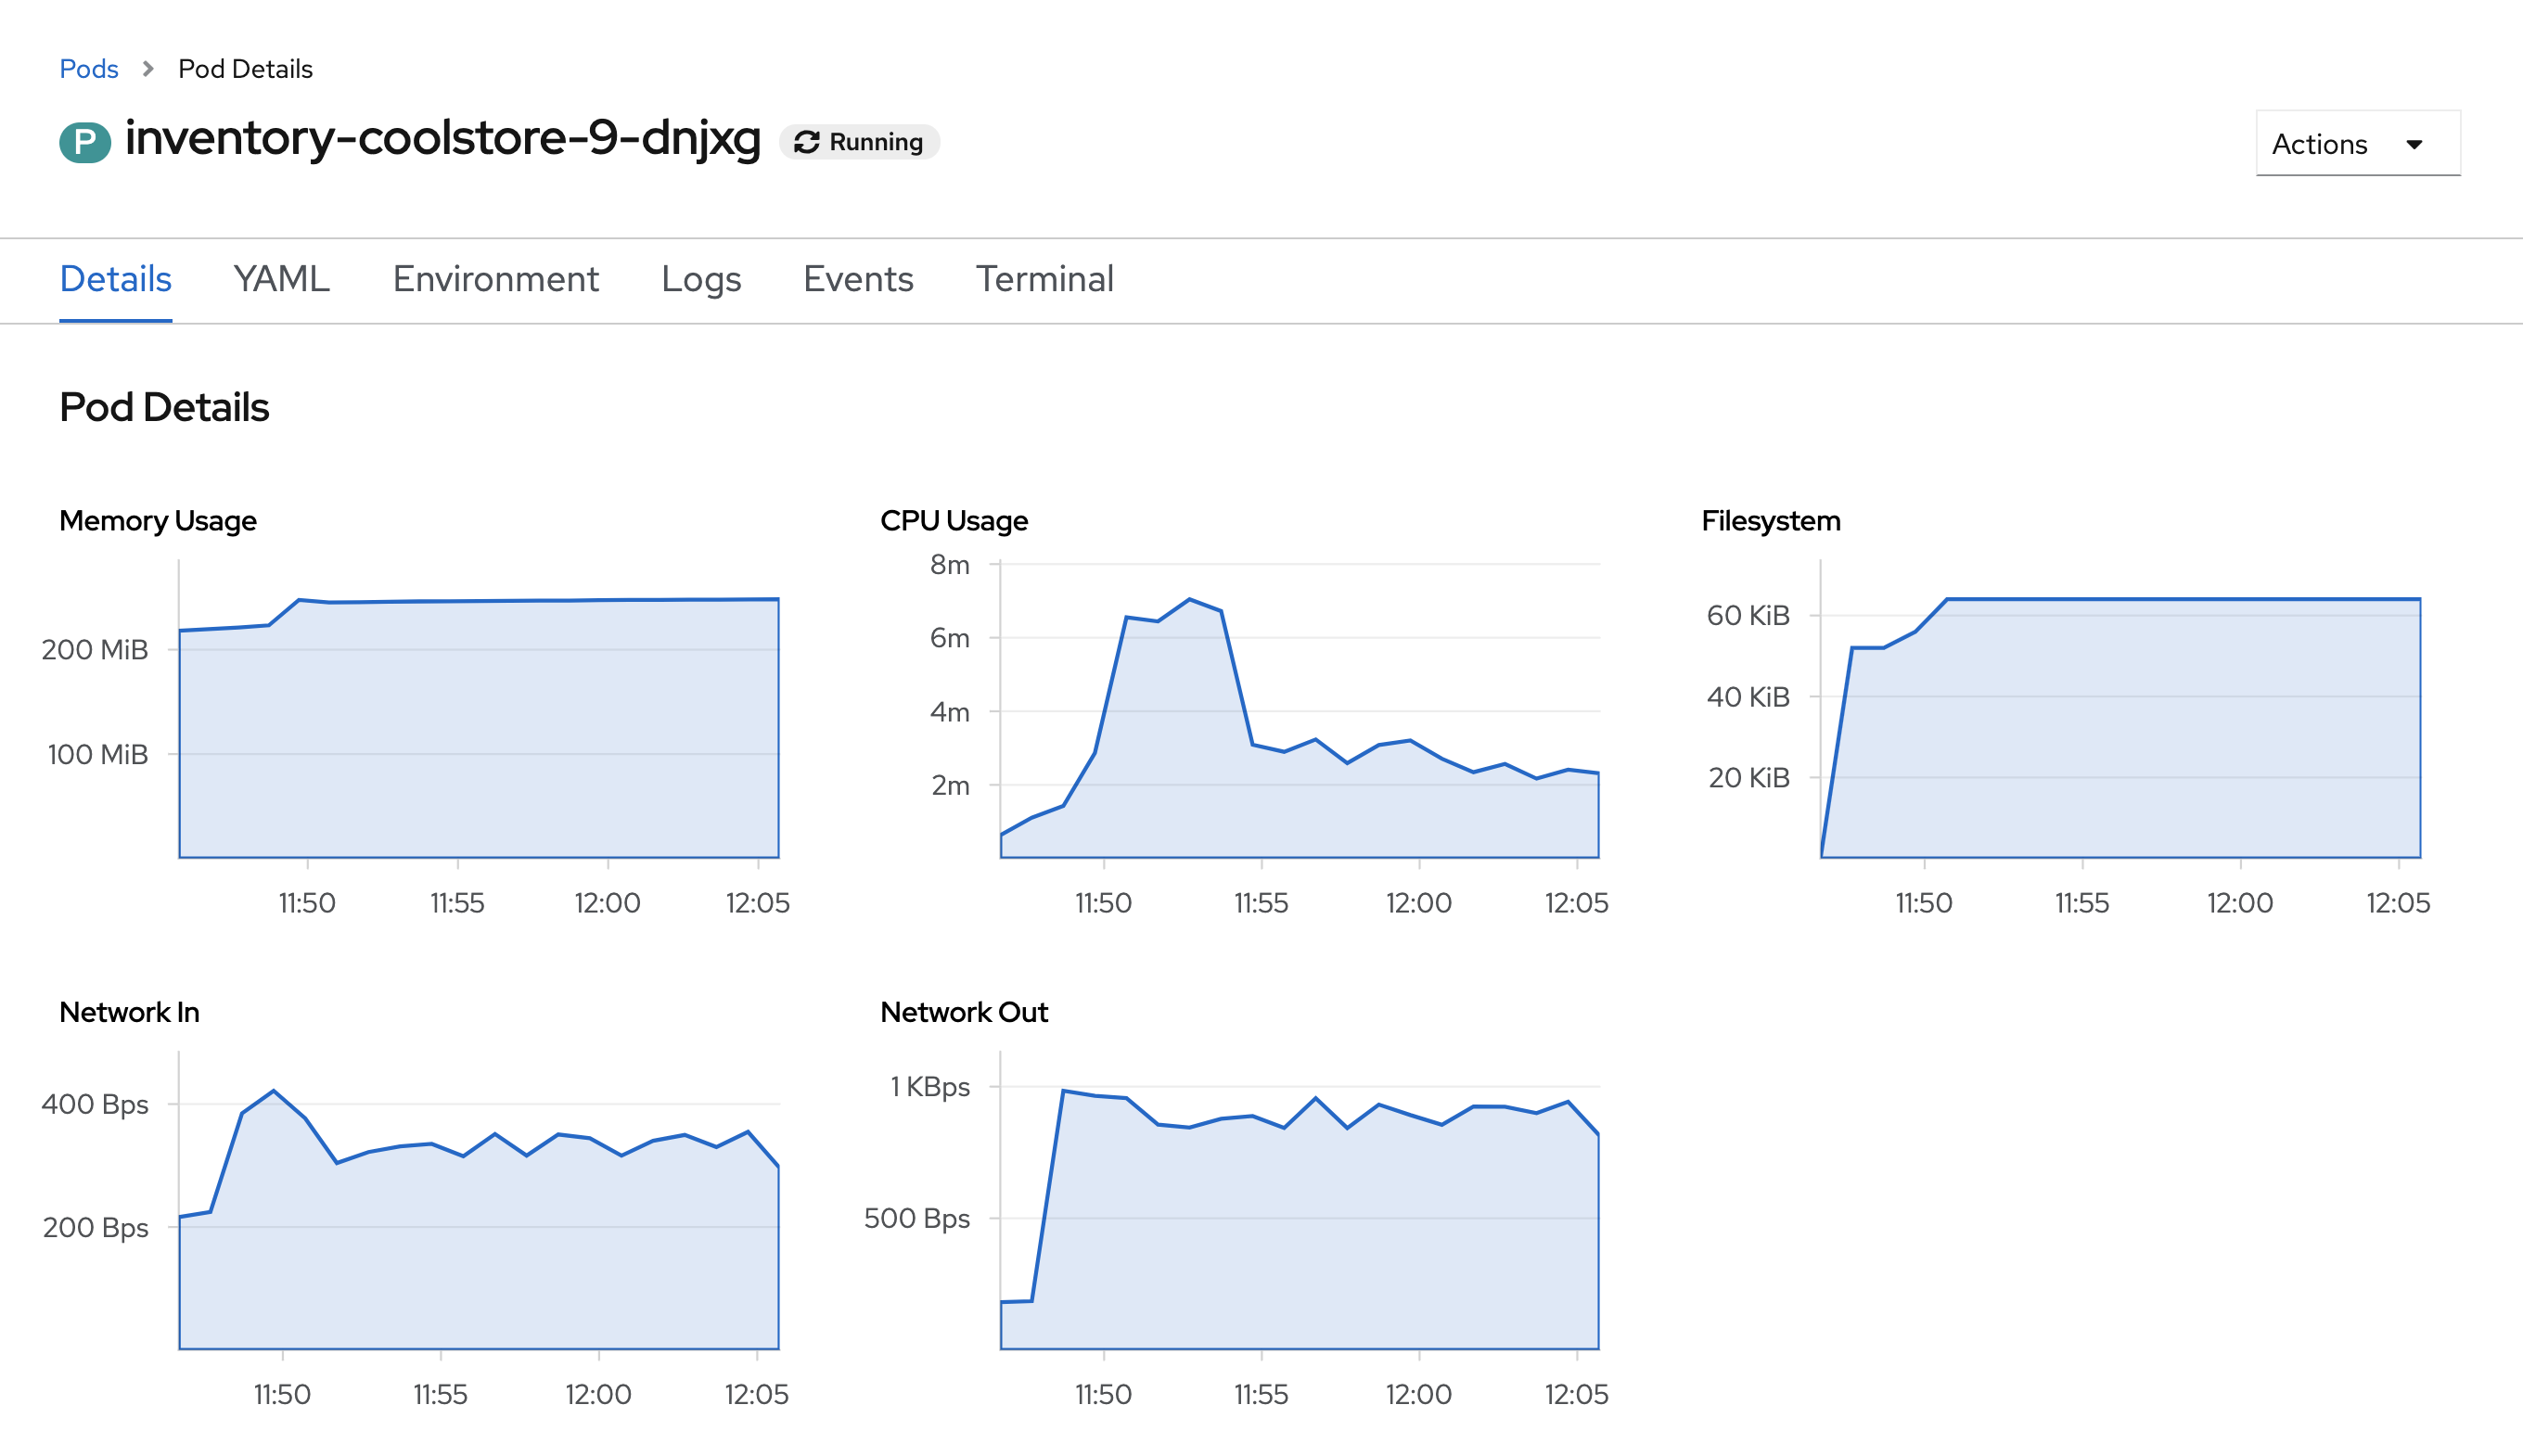
From the Developer view, click on 'Topology' → any Deployment (D) and click on the associated Pod (P)
In the pod overview, you can see a more detailed view of the pod consumption. The graphs can be found under the Metrics heading, or Details in earlier versions of the OpenShift console.
Well done! You are ready to move on to the next lab.