Observability
When building distributed systems, you should use metrics to ensure that you see all your requests, including errors or slow requests etc. Tracing helps you with following the evolution of a transaction and it usually needs to be sampled at high volumes of traffic (because the amount of data increases proportionally to the traffic volume).
Setup
As we will need to correlate our metrics and traces, we should make a small setup for Jaeger, OpenTelemetry Collector and Prometheus. The OpenTelemetry Collector acts as a proxy for Jaeger and Prometheus.
| This setup has development purposes and is due to resource constraints that exist within Red Hat OpenShift Developer Sandbox. |
First, open the Web Terminal of your Sandbox and type the command:
curl -O "https://raw.githubusercontent.com/redhat-scholars/kube-native-java-apps/master/apps/kubefiles/{jaeger-server-configmap.yaml,prometheus-configmap.yaml,otel-configmap.yaml,jaeger-deployment.yaml,jaeger-service.yaml,otel-collector-deployment.yaml,otel-collector-service.yaml,prometheus-deployment.yaml}"This will download the files used to configure Jaeger/Prometheus/OpenTelemetry collector.
Next, please run the following commands in the same terminal:
kubectl apply -f jaeger-server-configmap.yaml
kubectl apply -f prometheus-configmap.yaml
kubectl apply -f otel-configmap.yaml
kubectl apply -f jaeger-deployment.yaml
kubectl apply -f jaeger-service.yaml
kubectl apply -f otel-collector-deployment.yaml
kubectl apply -f otel-collector-service.yaml
oc new-app --docker-image=quay.io/prometheus/prometheus:latest
kubectl replace -f prometheus-deployment.yaml
oc expose svc prometheus
oc expose svc jaeger --port=16686 --generator="route/v1"
Micrometer
When running applications in production we need to send monitoring information to some services like Prometheus.
Quarkus provides JVM and other statistics out-of-box with the Metrics extension, but it’s very valuable for our application to produce its own metrics. Let’s see how we can achieve it in this chapter.
Just open a new terminal window, and make sure you’re at the root of your project, then run:
mvn quarkus:add-extension -Dextensions="io.quarkus:quarkus-micrometer-registry-prometheus"Configuration of common tags
When deploying across multiple projects/namespaces is always good to have a unified view over some application metrics. Let’s define several common tags for the application, varying in value at deployment time:
package org.acme;

import io.smallrye.config.ConfigMapping;

@ConfigMapping(prefix = "global")
interface GlobalTagsConfig {
     String PROFILE = "profile";
     String REGION = "region";
     String COUNTRY="country";

     String region();
     String country();
}
@ConfigMapping(prefix = "global") annotation maps configurations from application.properties prefixed by global:
global.region=${REGION:CEE} (1)
global.country=${COUNTRY:'Romania'}| 1 | Environment configuration will be named REGION and has the default value CEE. |
Further, we will propagate these configurations by via MeterFilter customization:
package org.acme;

import io.micrometer.core.instrument.Tag;
import io.micrometer.core.instrument.config.MeterFilter;
import io.quarkus.runtime.configuration.ProfileManager;

import javax.enterprise.inject.Produces;
import javax.inject.Inject;
import javax.inject.Singleton;
import java.util.Arrays;

@Singleton
public class CustomConfiguration {

    @Inject
    GlobalTagsConfig tagsConfig;

    @Produces
    @Singleton
    public MeterFilter configureTagsForAll() {
        return MeterFilter.commonTags(Arrays.asList(
           Tag.of(GlobalTagsConfig.REGION, tagsConfig.region()),
           Tag.of(GlobalTagsConfig.COUNTRY, tagsConfig.country()),
           Tag.of(GlobalTagsConfig.PROFILE, ProfileManager.getActiveProfile())
        ));
    }

}
Metrics definition at endpoint level
In application.properties please add the following configurations:
quarkus.micrometer.binder.http-client.enabled=true(1)
quarkus.micrometer.binder.http-server.enabled=true(2)
quarkus.micrometer.binder.system=true(3)
quarkus.micrometer.export.prometheus.enabled=true(4)
quarkus.micrometer.export.prometheus.path=/metrics(5)
quarkus.micrometer.binder.jvm=true(6)| 1 | Outbound HTTP request metrics support. |
| 2 | Inbound HTTP request metrics support. |
| 3 | Micrometer System metrics support. |
| 4 | Enable export of metrics to Prometheus. |
| 5 | Customize the path where metrics are exposed. |
| 6 | Micrometer JVM metrics support. |
Go to the Swagger UI and make several requests.
Now go to http://localhost:8080/metrics and search for http_server_requests_seconds summary. You will observe that your requests were automatically measured and they also contain the global tags:
# TYPE http_server_requests_seconds summary
http_server_requests_seconds_count{country="'Romania'",method="GET",outcome="SUCCESS",profile="dev",region="CEE ",status="200",uri="/api",} 12.0
http_server_requests_seconds_sum{country="'Romania'",method="GET",outcome="SUCCESS",profile="dev",region="CEE ",status="200",uri="/api",} 2.058467696
http_server_requests_seconds_count{country="'Romania'",method="GET",outcome="SUCCESS",profile="dev",region="CEE ",status="200",uri="/metrics",} 2.0
http_server_requests_seconds_sum{country="'Romania'",method="GET",outcome="SUCCESS",profile="dev",region="CEE ",status="200",uri="/metrics",} 0.075653411
The metrics listed will be exported to Prometheus and further queried over time. You can also define your own custom metrics, but please keep in mind the Out Of the Box ones as well.
Next, deploy the modified application to the Red Hat Developer Sandbox using:
mvn clean package -DskipTests -Dquarkus.container-image.build=true -Dquarkus.container-image.push=true -Dquarkus.kubernetes.deploy=trueThis will recreate the container image and redeploy your application. Find the route associated to your application (the one you used in [Kubernetes Advanced]) using either the UI or the in-browser terminal:
export ROUTE_URL=http://$(kubectl get route quarkus-app-workshop -o jsonpath='{.spec.host}')Let’s make a few curl requests:
for i in {1..16}; do curl -v $ROUTE_URL/api; doneWhen we made the setup of the project, we also exposed the Prometheus installation via a route. You can find that route using the following command and access Prometheus UI via it:
export ROUTE_URL=http://$(kubectl get route prometheus -o jsonpath='{.spec.host}')In Prometheus UI enter the following PromQL query to see the average over time of requests to the /api endpoint:
avg_over_time(http_server_requests_seconds_count{uri="/api"}[1h:5m])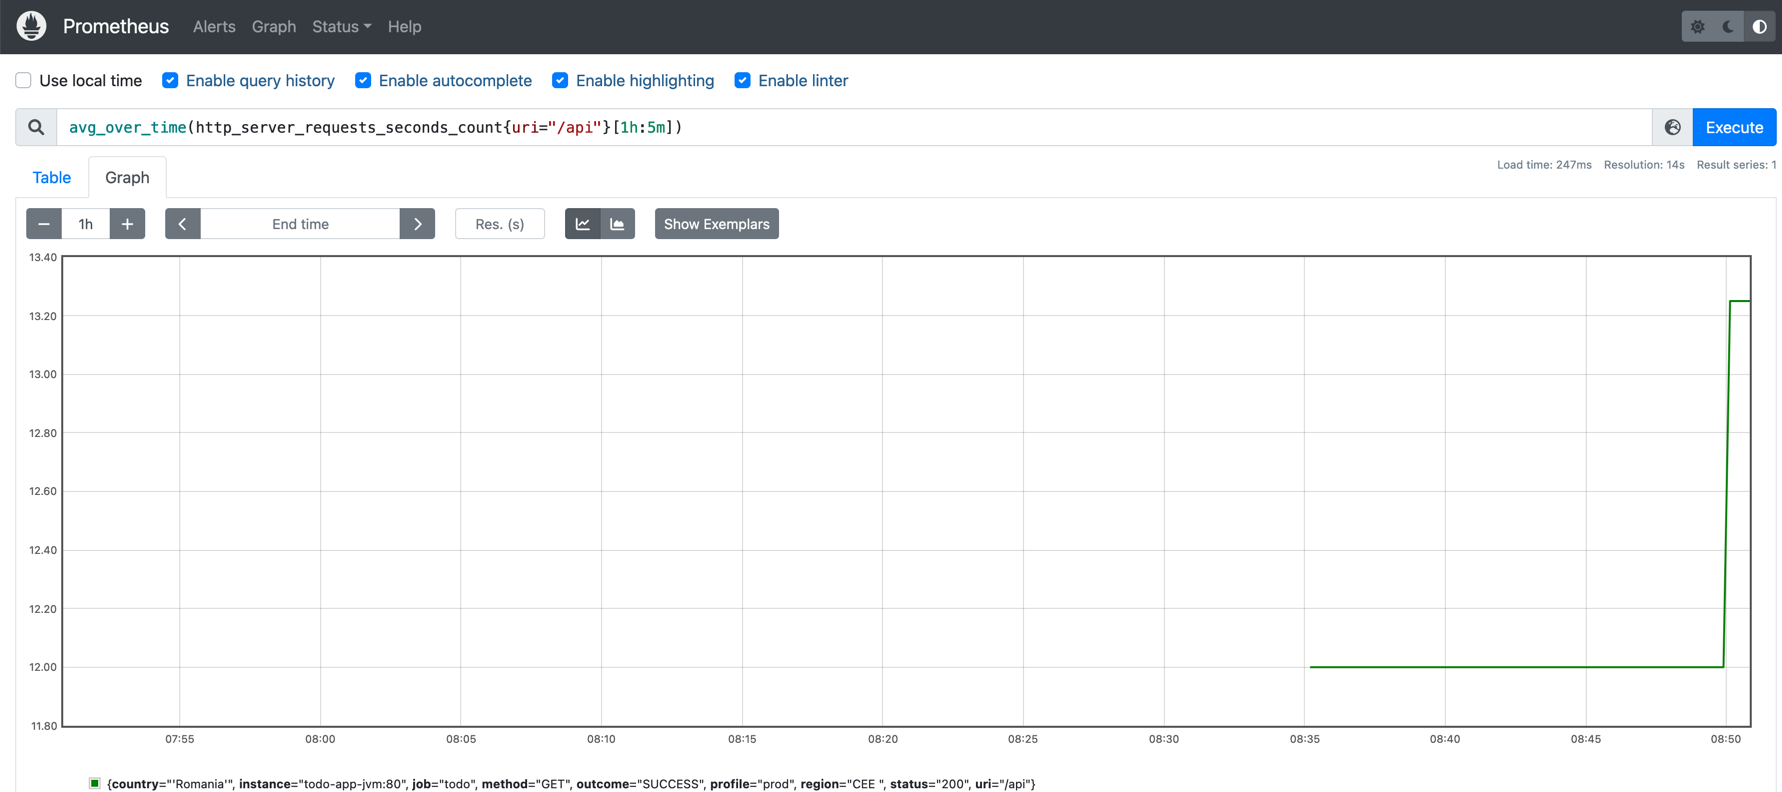
Jaeger
To configure our application using OpenTelemetry and Jaeger, we should add one more extension to its configuration:
mvn quarkus:add-extension -Dextensions="quarkus-opentelemetry-exporter-jaeger"OpenTelemetry propagates cross-cutting concerns through propagators that will share an underlying Context for storing state and accessing data across the lifespan of a distributed transaction.
In order to work with propagators, the following dependency should be added to pom.xml:
    <dependency>
      <groupId>io.opentelemetry</groupId>
      <artifactId>opentelemetry-extension-trace-propagators</artifactId>
    </dependency>
Furthermore, as we wish trace our data through Jaeger and see its performance within Prometheus, we should add the following configuration in application.properties:
quarkus.opentelemetry.tracer.exporter.otlp.endpoint=http://otel-collector:8889(1)
quarkus.opentelemetry.propagators=tracecontext,baggage,jaeger(2)
quarkus.opentelemetry.tracer.exporter.jaeger.enabled=true(3)
quarkus.opentelemetry.tracer.exporter.jaeger.endpoint=http://jaeger:14250/api/traces(4)
quarkus.opentelemetry.tracer.enabled=true
quarkus.opentelemetry.tracer.sampler.parent-based=true
quarkus.opentelemetry.tracer.suppress-non-application-uris=false
quarkus.log.console.format=%d{HH:mm:ss} %-5p traceId=%X{traceId}, spanId=%X{spanId}, sampled=%X{sampled} [%c{2.}] (%t) %s%e%n| 1 | The OTLP endpoint to connect to. |
| 2 | Comma separated list of OpenTelemetry propagators which must be supported. |
| 3 | Export to Jaeger is enabled. |
| 4 | Jaeger exported endpoint. |
We should capture the situations when trying to delete a ToDo item that does not exist throws an exception, so we will modify the TodoResource.java class:
package org.acme;

import org.eclipse.microprofile.rest.client.inject.RestClient;


import javax.transaction.Transactional;
import javax.validation.Valid;
import java.util.List;


import javax.ws.rs.DELETE;
import javax.ws.rs.GET;
import javax.ws.rs.OPTIONS;
import javax.ws.rs.PATCH;
import javax.ws.rs.POST;
import javax.ws.rs.Path;
import javax.ws.rs.PathParam;
import javax.ws.rs.WebApplicationException;
import javax.ws.rs.core.Response;
import javax.ws.rs.core.Response.Status;

import io.quarkus.panache.common.Sort;


@Path("/api")
public class TodoResource {

    @RestClient
    ActivityService service;


    @GET
    @Path("load")
    @Transactional
    public Response load() {
        for (long i = 0; i < 10; i++) {
            service.getActivity().persist();
        }
        return Response.status(Status.CREATED).build();
    }

    @OPTIONS
    public Response opt() {
        return Response.ok().build();
    }

    @GET
    public List<Todo> getAll() {
        return Todo.listAll(Sort.by("order"));
    }

    @GET
    @Path("/{id}")
    public Todo getOne(@PathParam("id") Long id) {
        Todo entity = Todo.findById(id);
        if (entity == null) {
            throw new WebApplicationException("Todo with id of " + id + " does not exist.", Status.NOT_FOUND);
        }
        return entity;
    }

    @POST
    @Transactional
    public Response create(@Valid Todo item) {
        item.persist();
        return Response.status(Status.CREATED).entity(item).build();
    }

    @PATCH
    @Path("/{id}")
    @Transactional
    public Response update(@Valid Todo todo, @PathParam("id") Long id) {
        Todo entity = Todo.findById(id);
        entity.id = id;
        entity.completed = todo.completed;
        entity.order = todo.order;
        entity.title = todo.title;
        entity.url = todo.url;
        return Response.ok(entity).build();
    }

    @DELETE
    @Transactional
    public Response deleteCompleted() {
        Todo.deleteCompleted();
        return Response.noContent().build();
    }

    @DELETE
    @Transactional
    @Path("/{id}")
    public Response deleteOne(@PathParam("id") Long id) {
        Todo entity = Todo.findById(id);
        if (entity == null) {
            Span.current().setAttribute("alarm", "unexpected")(1)
                    .setStatus(StatusCode.ERROR, "Something wrong happened!");(2)
            throw new WebApplicationException("Todo with id of " + id + " does not exist.", Status.NOT_FOUND);
        }
        entity.delete();
        return Response.noContent().build();
    }
}| 1 | Attach an attribute to the current span. |
| 2 | Set a status for the situation when the error occurs. |
Next, deploy the modified application to the Red Hat Developer Sandbox using:
mvn clean package -DskipTests -Dquarkus.container-image.build=true -Dquarkus.container-image.push=true -Dquarkus.kubernetes.deploy=trueThis will recreate the container image and redeploy your application. Find the route associated to your application (the one you used in [Kubernetes Advanced]) using either the UI or the in-browser terminal:
export ROUTE_URL=http://$(kubectl get route quarkus-app-workshop -o jsonpath='{.spec.host}')Let’s make a few curl requests:
for i in {1..16}; do curl -X 'DELETE' -v $ROUTE_URL/api/100 -H 'accept: */*'; doneTo observe the traces associated to your requests go to the Jaeger UI:
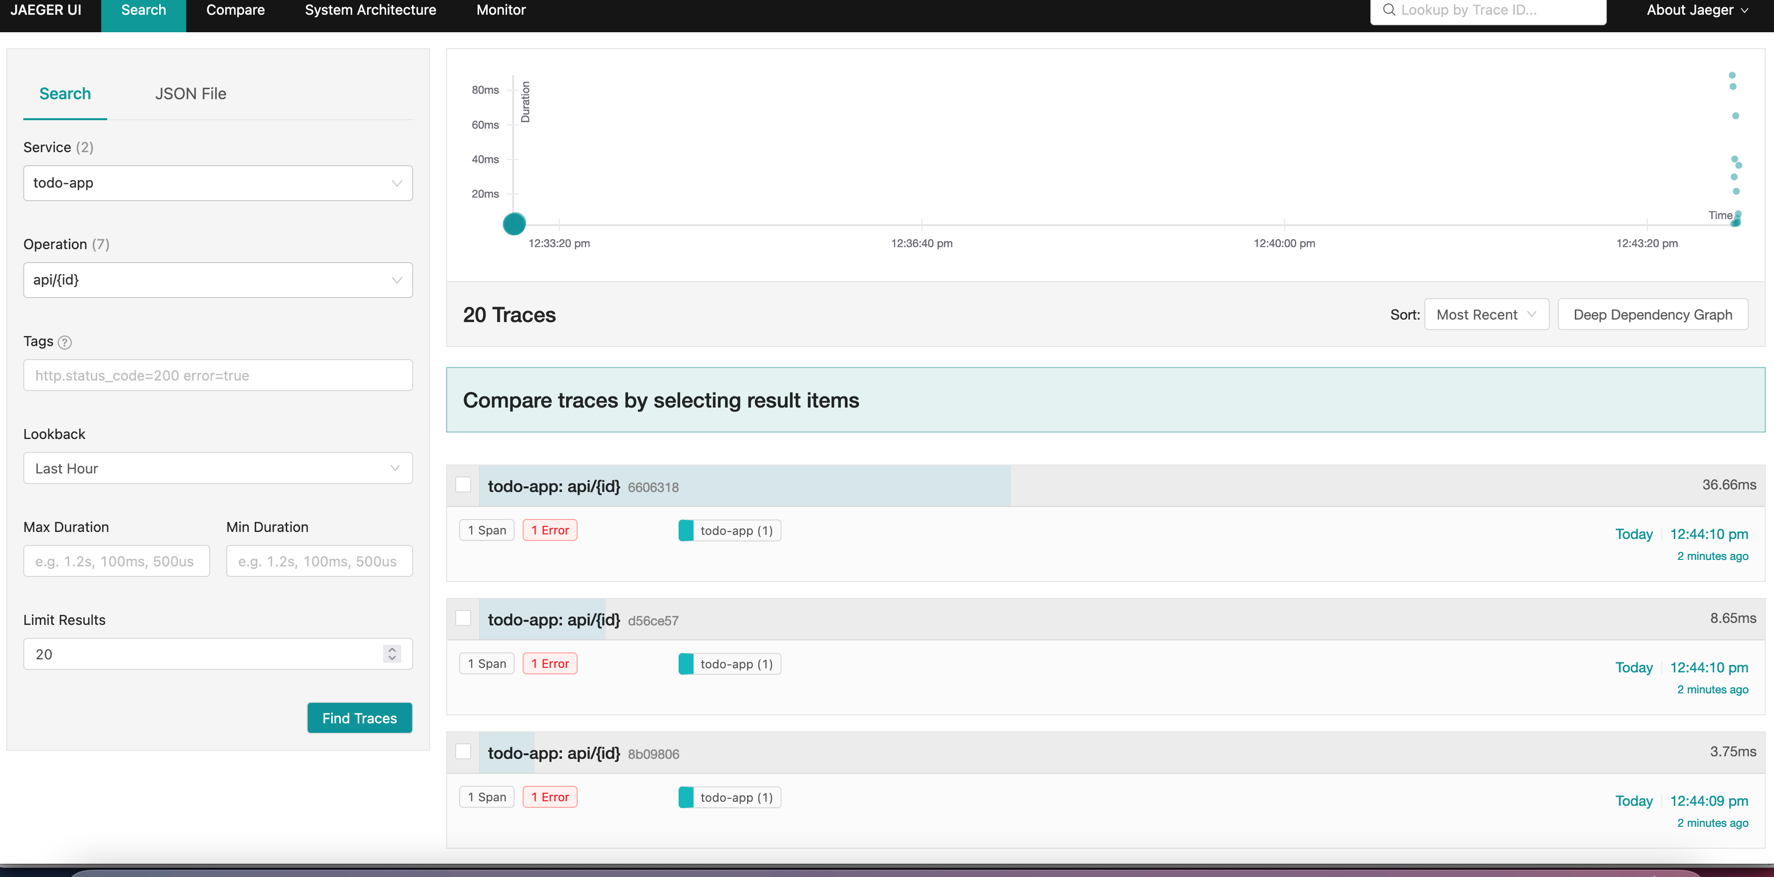
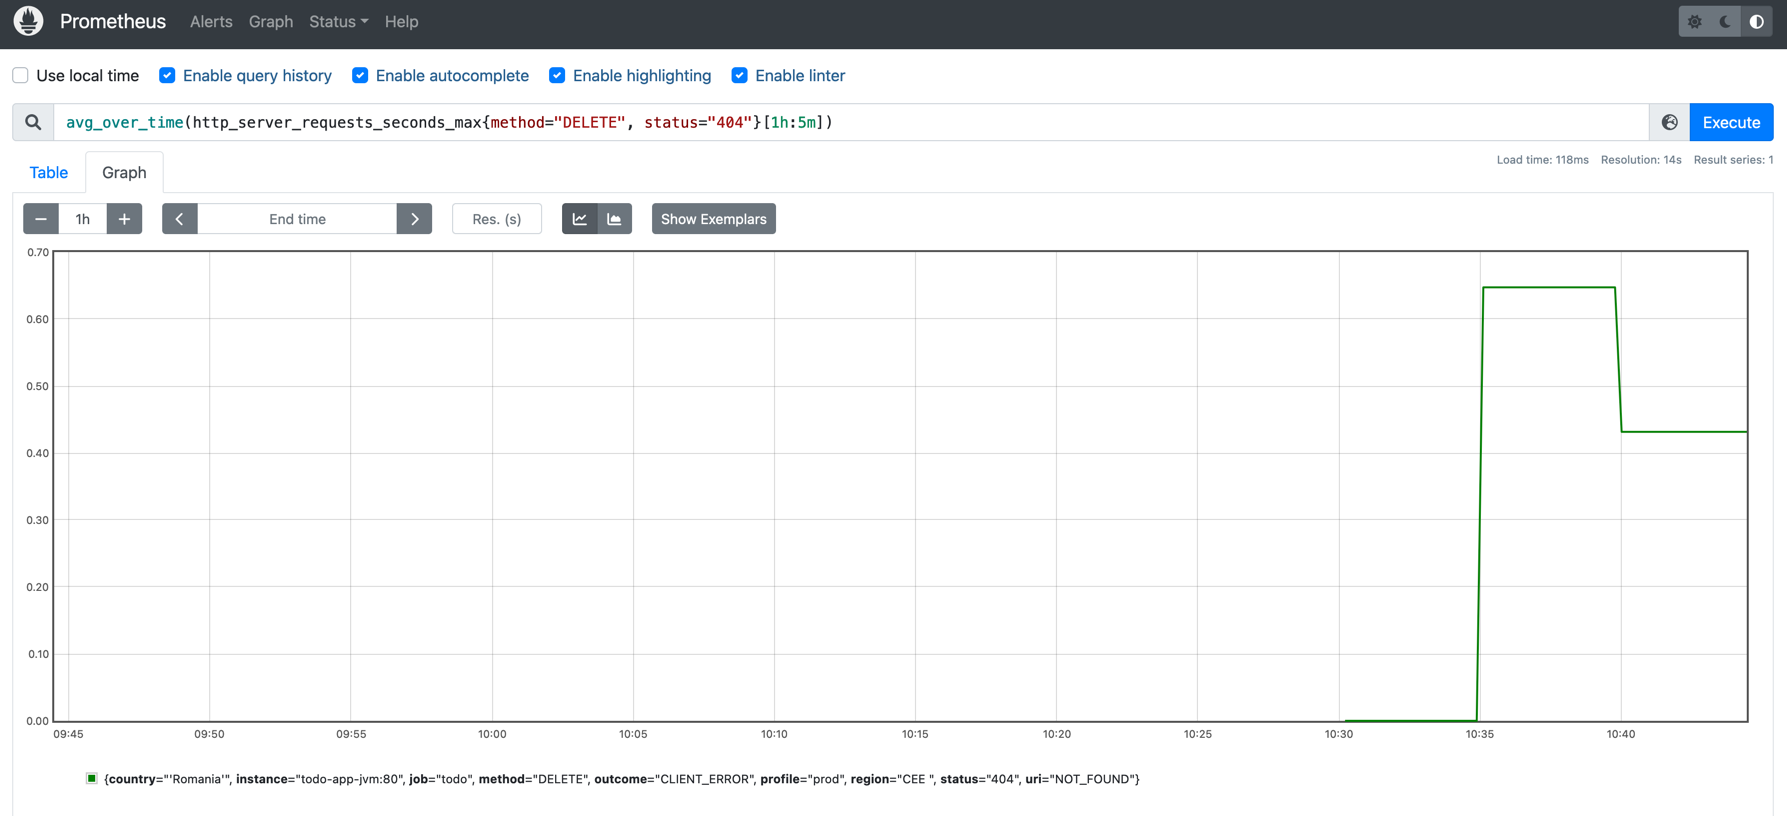
Inspect one of the traces by clicking on it. To correlate the state of these failed situations with the metrics, you can use the following PromQL query in Prometheus:
avg_over_time(http_server_requests_seconds_max{method="DELETE", status="404"}[1h:5m])