Quarkus Cloud Native
| You need to finish the [Kubernetes Deployment] section before advancing into adjusting resources. |
By default, containers run with unbounded compute resources on a Kubernetes cluster. Developer Sandbox is a managed OpenShift environment, and its cluster resources are tailored per development needs.
Discovering project resource limits
With resource quotas, cluster administrators can restrict resource consumption and creation on a namespace basis.
There will always be concerns that one Pod or Container could monopolize all available resources.
To avoid that, within a namespace, a Pod or Container can consume as much CPU and memory as defined by the namespace’s/project’s resource quota.
To discover the resource quota established for your namespace/project you can run the following command:
kubectl get resourcequota
kubectl get limitrange
At namespace/project level a LimitRange policy is employed to constrain resource allocations (to Pods or Containers).
You can find out the LimitRange established for a namespace by running oc get limitrange and ask for its description via:
kubectl describe limitrange resource-limitsThe output should be something similar to:
Name:       resource-limits
Namespace:  <your-user>-dev
Type        Resource  Min  Max  Default Request  Default Limit  Max Limit/Request Ratio
----        --------  ---  ---  ---------------  -------------  -----------------------
Container   cpu       -    -    10m              1              -
Container   memory    -    -    64Mi             750Mi          -
The above LimitRange has enforced the default request/limit for compute resources in the namespace and automatically injects them to Containers at runtime.
Adjusting container resources
By using a tool called hey, you can run a simple load test on your server and see how your system performs under different circumstances.
Let’s expose the service deployed in [Kubernetes Deployment] section by using the browser terminal and type:
oc expose svc quarkus-app-workshopLet’s run a hey command against the route exposed by previous deployment:
export ROUTE_URL=http://$(kubectl get route quarkus-app-workshop -o jsonpath='{.spec.host}')
hey -n 1000 -c 200 $ROUTE_URL/api
In the Developer Sandbox click on Observe and select the Metric tab.
You can select CPU Usage or Memory Usage query to check the resources consumed by each of your pods:
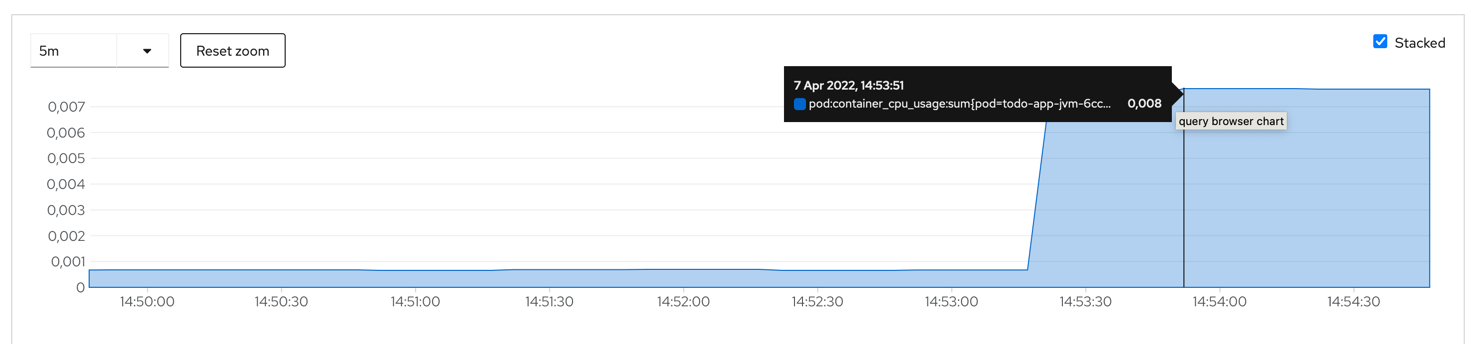
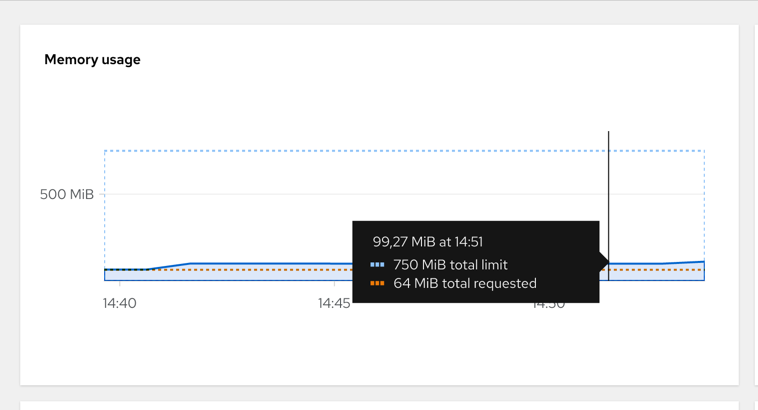
Based on that you can adjust your container resources in application.properties:
# Configuration file

quarkus.kubernetes.resources.limits.cpu=200m
quarkus.kubernetes.resources.limits.memory=280Mi
quarkus.kubernetes.resources.requests.cpu=100m
quarkus.kubernetes.resources.requests.memory=140Mi
The resources in target/kubernetes folder will be reworked at compile time and contain these new definitions.
You can now re-deploy the changes by using the command:
mvn clean package -Dquarkus.kubernetes.deploy=true -Dquarkus.container-image.push=trueDefine custom health checks
Add the health monitoring extension
In the terminal window please execute the following command:
./mvnw quarkus:add-extension -Dextensions="io.quarkus:quarkus-smallrye-health"If you did not stop DevMode and inspect again target/kubernetes/kubernetes.yml, you
will notice that it had changed. Your Deployment resource will contain a few lines like to:
          livenessProbe:
            failureThreshold: 3
            httpGet:
              path: /q/health/live
              port: 8080
              scheme: HTTP
            initialDelaySeconds: 0
            periodSeconds: 30
            successThreshold: 1
            timeoutSeconds: 10
          name: tutorial-app
          ports:
            - containerPort: 8080
              name: http
              protocol: TCP
          readinessProbe:
            failureThreshold: 3
            httpGet:
              path: /q/health/ready
              port: 8080
              scheme: HTTP
            initialDelaySeconds: 0
            periodSeconds: 30
            successThreshold: 1
timeoutSeconds: 10| You can access these endpoints also in your local at http://localhost:8080/q/health/ready or http://localhost:8080/q/health/live. |
Default health checks
In dev mode, all your heath checks are visible in health UI: http://localhost:8080/q/health-ui/.
Some extensions may provide default health checks, including that the extension will automatically register its health checks.
For example, quarkus-agroal (that is used to manage Quarkus datasources) automatically registers a readiness health check that will validate each datasource.
Quarkus has automatic readiness probes added when you use certain extensions:
-
datasource A probe to check database connection status.
-
kafka A probe to check kafka connection status. In this case you need to enable manually by setting quarkus.kafka.health.enabled to true.
-
mongoDB A probe to check MongoDB connection status.
-
neo4j A probe to check Neo4J connection status.
-
artemis A probe to check Artemis JMS connection status.
-
kafka-streams Liveness (for stream state) and Readiness (topics created) probes.
-
vault A probe to check Vault conection status.
-
gRPC A readiness probe for the gRPC services.
-
Cassandra A readiness probe to check Cassandra connection status.
-
Redis A readiness probe to check Redis connection status.
Customize health endpoints and readiness probe
You can change the root path to the health endpoints by setting the following property in src/main/resources/application.properties:
quarkus.smallrye-health.root-path=/healthThe Quarkus Kubernetes extension will take into account your custom probe definitions when generating their YAML.
If you reload the context in DevMode (by pressing s), you would notice that your Kubernetes/OpenShift manifests have changed and take into account your new configuration.
We can customize a readiness probe to check the availability of the endpoint https://www.boredapi.com:
package org.acme;

import io.smallrye.health.checks.UrlHealthCheck;
import org.eclipse.microprofile.config.inject.ConfigProperty;
import org.eclipse.microprofile.health.HealthCheck;
import org.eclipse.microprofile.health.Readiness;

import javax.enterprise.context.ApplicationScoped;
import javax.ws.rs.HttpMethod;

@ApplicationScoped
public class CustomHealthCheck {

    @ConfigProperty(name = "quarkus.rest-client.\"org.acme.ActivityService\".url")
    String externalURL;

    @Readiness (1)
    HealthCheck checkURL() {
        return new UrlHealthCheck(externalURL) (2)
                .name("external-url-check").requestMethod(HttpMethod.GET).statusCode(200);
    }

}| 1 | Annotate the method with org.eclipse.microprofile.health.Readiness to signal its implementation. |
| 2 | UrlHealthCheck checks if host is reachable using a Http URL connection. |
|
Quarkus comes with some HealthCheck implementations for you to check status of different components:
|