Risk Management in RHACS
Risks main dashboard
Let’s take a look at the Risk view, where we go beyond the basics of vulnerabilities to understand how deployment configuration and runtime activity impact the likelihood of an exploit occurring and how successful those exploits will be.
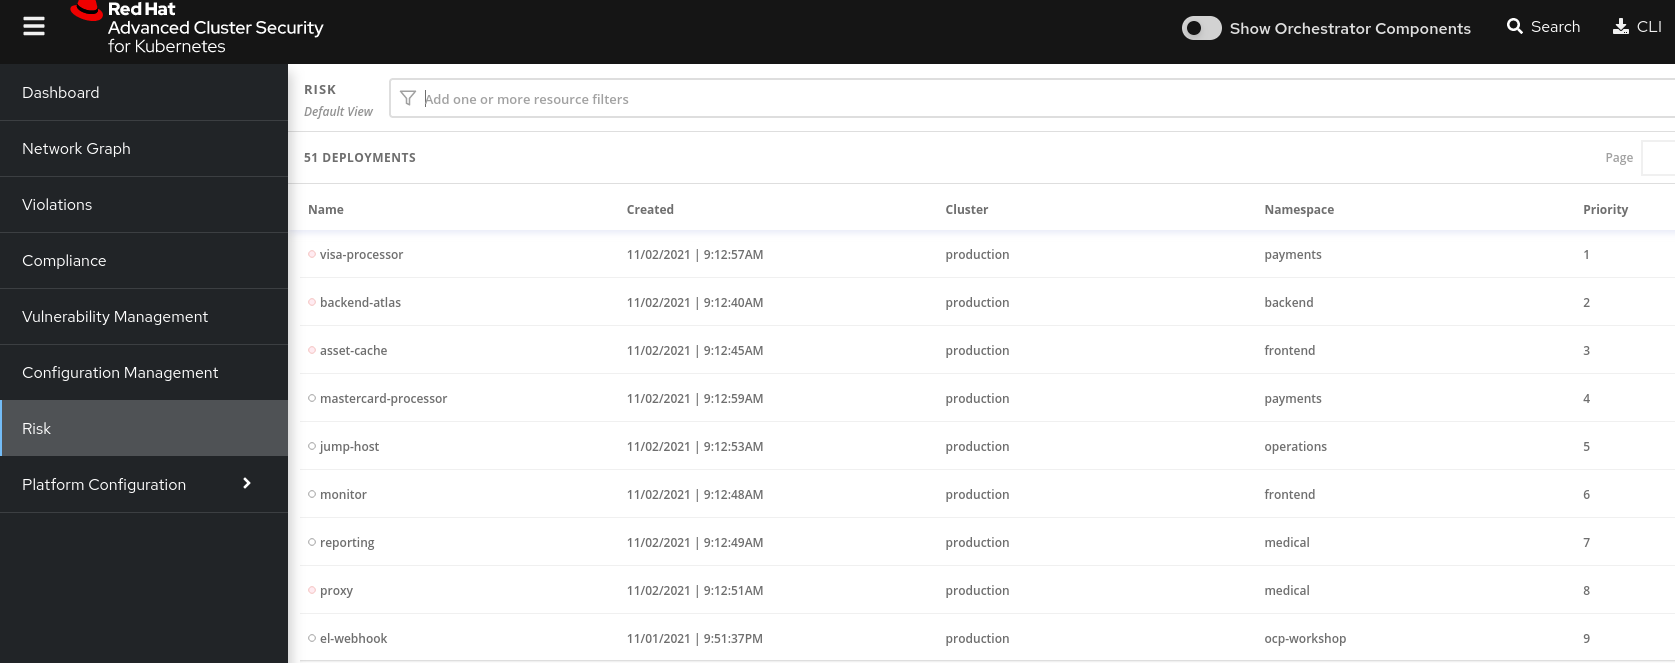
This list view shows all deployments, in all clusters and namespaces, ordered by Risk priority.
Risk is also influenced by runtime activity - and Deployments that have activity that could indicate a breach in progress have a red dot on the left. Obviously - the first one in the list should be our first focus.
The reality of security is that it’s just not possible to tackle all sources of Risk, so organizations end up prioritizing their efforts. We want RHACS to help inform that prioritization.
Single Deployment Details
-
Click on the number 1 deployment, visa-processor to bring up the
RISK INDICATORS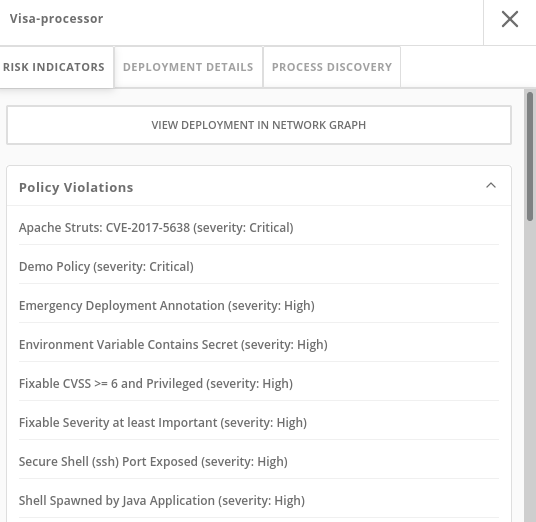
The details tab shows why this deployment is considered such a high risk.
The deployment has serious, fixable vulnerabilities, but it also has configurations like network ports and service exposure outside the cluster, making it more likely to be attacked.
In addition, other configurations like privileged containers mean that a successful attacker has access to the underlying host network and filesystem, including other containers running on that host.
-
Navigate to the bottom of the
RISK INDICATORSpage to the RBAC configuration section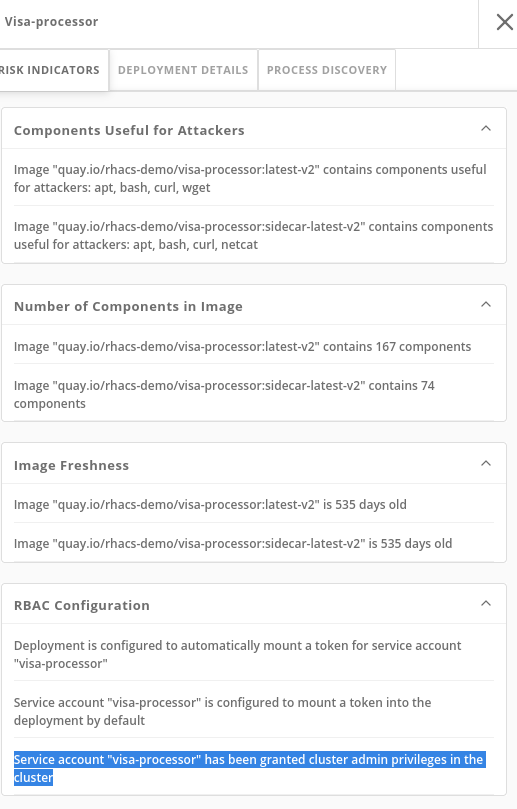
At the bottom, we see another serious problem: the service account associated with this deployment has been given
cluster adminprivileges, which means that a successful attacker gains full control over this entire OpenShift cluster which could result in compromise of the entire cluster.
All of these configurations are gleaned automatically by RHACS from OpenShift, and the built-in policies assign a risk score to each, meaning that this Risk report is available as soon as you start running RHACS.
Process Discovery / Runtime
Navigate to the PROCESS DISCOVERY tab of the details page.
Even a perfectly configured application has the potential for an attacker to gain access and cause havoc.
Here we show how RHACS continuously monitors runtime activity within pods in the deployment, building a baseline of observed behavior, and tracking deviations from that baseline.
-
Click on the header bar within the
Event Timelinesection ( in the picture, at any point on the surface covered by the red rectangle )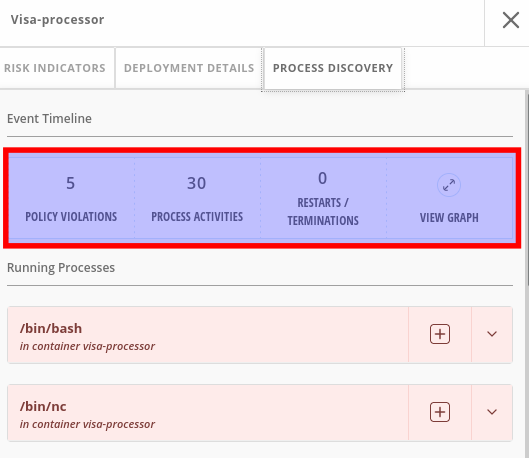
The event timeline shows us, for each pod, the process activity that has occurred over time.
-
Click on the squares / circles for process activity
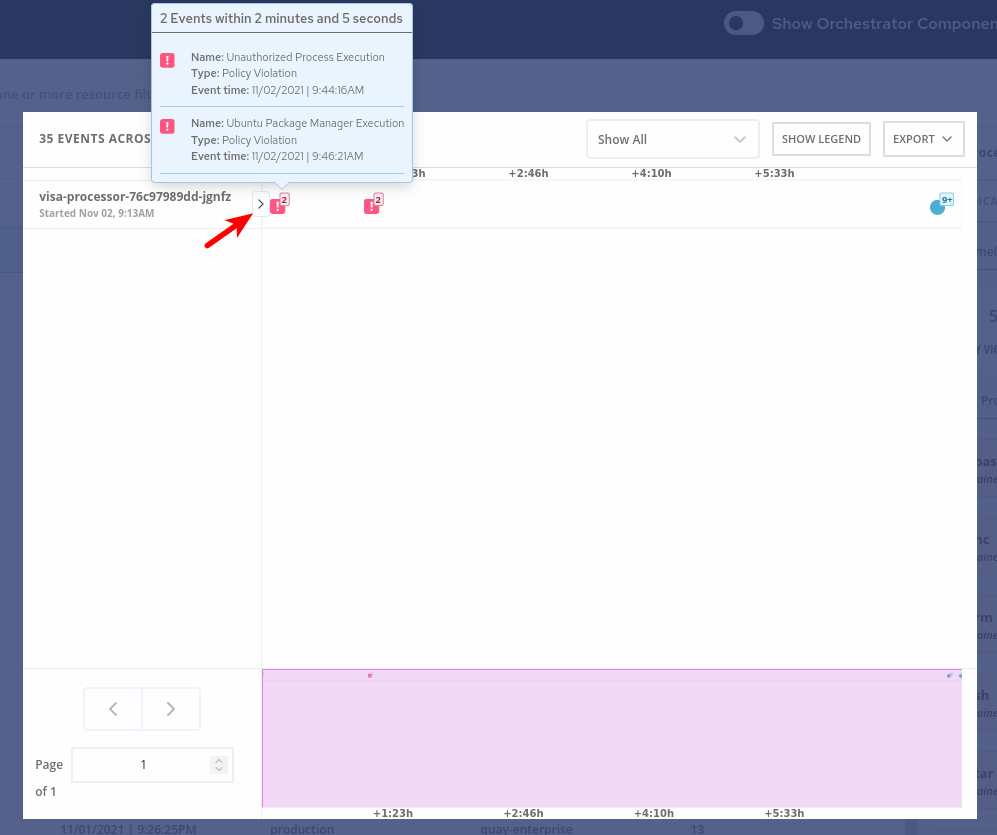
If you click in the greater than symbol (pointed by the red arrow in the above picture) you can expand the activity and see the containers inside the pod.
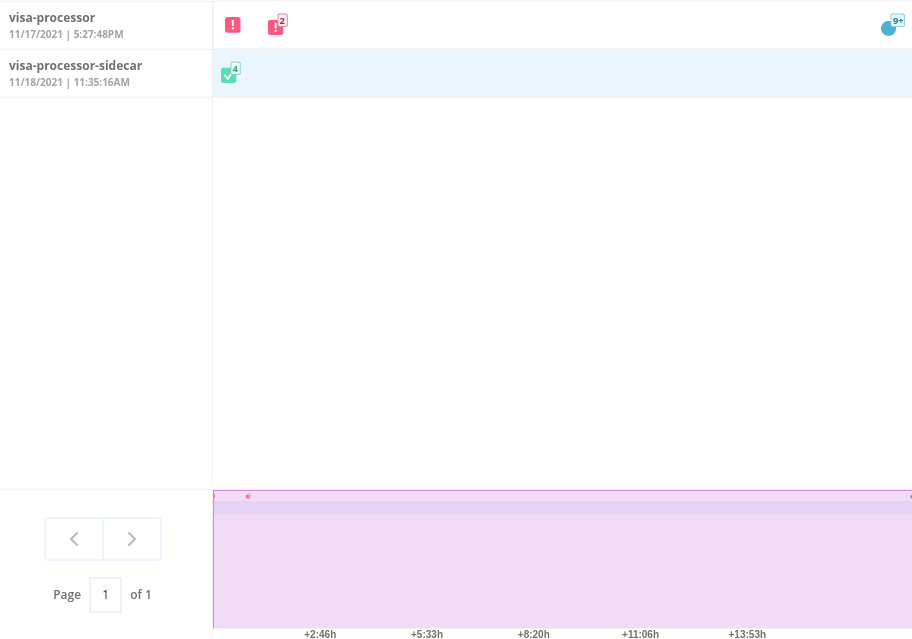
We can take advantage of the constrained lifecycle of containers for better runtime incident detection and response.
Containers should be pretty boring - they’re not general purpose Virtual machines. They typically have a period of startup, with some initialization, and then settle down to a small number of processes running continuously and making or receiving connections.
Deviations from the baseline can be used to take enforcement action and alert team members. Runtime activity rules can be combined with other activity
Filtering
Most UI pages have a filters section at the top that allows you to narrow the reporting view to matching or non-matching criteria.
Almost all of the attributes that RHACS gathers are filterable
It’s really useful here in Risk when you know what you’re looking for - when you want answers to questions like “what applications have CVE-2020-1008 present".
For example, let’s use the following filters:
Filtering
Process Name - Java
CVE - CVE-2017-7376 (libxml2)
Translated: "Finding deployments that are running java processes and are affected by the CVE-2017-7376 vulnerability".
-
Click in the
Filtersbar (at the top, red rectangle). Start Typing "Process Name" and select theProcess Namekey ones it appears / autocompletes. Then typejava, press enter and click away to get the filters dropdown to clear.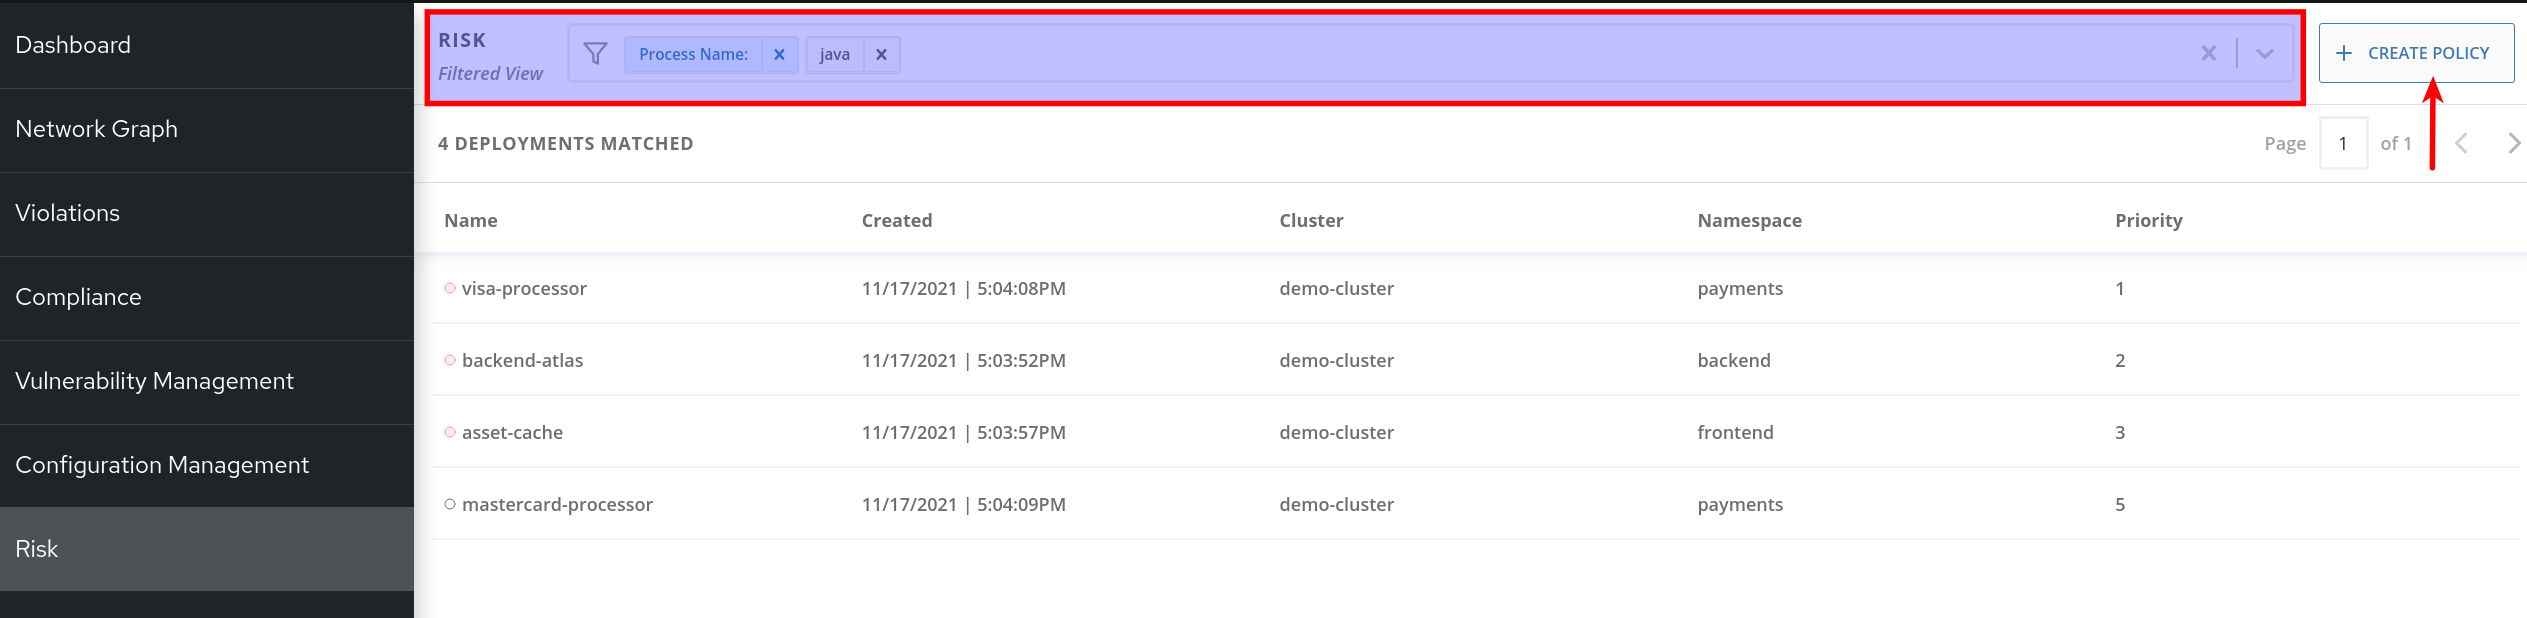
Do the same to add the
CVEfilter (is one of the keys shown by default).
|
Now that we’ve searched for interesting criteria, we can create a policy from the search filter to automatically identify our criteria going forward.
We can do that by clicking the |
Now let’s review the Network Graph and the Network Policies in RHACS!