Mutual TLS and Istio
|
Before Start
You should have NO virtualservice, destinationrule, gateway or policy (in |
In this chapter, we are going to see mTLS in Istio.
Testing mTLS
Depending on how you install Istio, you might have mTLS enabled or not.
If you are using Istio 1.5 or beyond, mTLS is enabled by default in permissive mode.
To check if mTLS is enabled or not just run the next command:
istioctl experimental authz check $(kubectl get pods -n tutorial|grep customer|awk '{ print $1 }'|head -1) -a...
LISTENER[FilterChain] HTTP ROUTE SNI ALPN CERTIFICATE mTLS (MODE) AuthZ (RULES)
virtualInbound[4] none no (none) no (none)
virtualInbound[5] inbound|8080|http|customer.tutorial.svc.cluster.local istio,istio-http/1.0,istio-http/1.1,istio-h2 noneSDS: default yes (PERMISSIVE) no (none)
virtualInbound[6] inbound|8080|http|customer.tutorial.svc.cluster.local none no (PERMISSIVE) no (none)
virtualInbound[7] inbound|8080|http|customer.tutorial.svc.cluster.local istio,istio-http/1.0,istio-http/1.1,istio-h2 noneSDS: default yes (PERMISSIVE) no (none)
virtualInbound[8] inbound|8080|http|customer.tutorial.svc.cluster.local none no (PERMISSIVE)Notice that mTLS is enabled in ALPN inbounds.
To validate how traffic is sent through Istio proxies, you can follow two ways for sniffing traffic.
If you are using minikube and the version of Istio Proxy container has tcpdump then tcpdump is your way.
But if you are in a more restricted environment (ie production) then ksniff is the way to proceed to sniff traffic.
Check the mTLS by sniffing traffic between services, which is a bit more tedious, open a new terminal tab and run next command:
CUSTOMER_POD=$(kubectl get pod | grep cust | awk '{ print $1}' ) (1)
kubectl exec -it $CUSTOMER_POD -c istio-proxy /bin/bash (2)| 1 | Get customer pod name |
| 2 | Open a shell inside pod |
Inside pod shell
ifconfig (1)
sudo tcpdump -vvvv -A -i eth0 '((dst port 8080) and (net 172.17.0.10))' (2)| 1 | Get IP of current pod (probably the IP represented at eth0 interface) |
| 2 | Capture traffic from eth0 (or your interface) of port 8080 and network 172.17.0.10 (your IP from ifconfig) |
Now all communication that happens between customer service and preference service is dumped in the console.
So now go to a terminal and execute:
customer => preference => recommendation v1 from 'recommendation-v1-b87789c58-mfrhr': 2Obviously, the response is exactly the same, but if you go to the terminal where you are executing tcpdump, you should see something like:
Z.!.X/K.............w$.?....&T...=..=..y..[.k..g..0..5.f%..vz|..t.....%..|...B..%r0.^k.y.....y.@l$O.....?...J..qc&...
.n$X.....l.#...... ..Q..u..jBI.Z.Eb$9.$.._...!.........~"Xx<....);........Z.
.y/E]......K......... .@s.3.\.
Notice that you cannot see any detail about the communication since it happened through TLS.
Now, let’s disable TLS:
kubectl replace -f istiofiles/disable-mtls.ymlAnd execute again:
customer => preference => recommendation v1 from 'recommendation-v1-b87789c58-mfrhr': 2And again check tcpdump output:
host: 0192.168.64.70:31380
user-agent: curl/7.54.0
accept: */*
x-forwarded-for: 172.17.0.1
x-forwarded-proto: http
x-envoy-internal: true
x-request-id: e5c0b90f-341b-9edc-ac3e-7dd8b33f0e8b
x-envoy-decorator-operation: customer.tutorial.svc.cluster.local:8080/
x-b3-traceid: ce289e960a639d11
x-b3-spanid: ce289e960a639d11
x-b3-sampled: 1
Now, you can see that since there is no TLS enabled, the information is not shadowed but in clear.
You can also use ksniff to sniff the traffic between pods.
To install ksniff we recommend you to do it through krew.
With krew installed:
kubectl krew install sniffThen get the IP of preference pod:
kubectl get pod -o wideNAME READY STATUS RESTARTS AGE IP NODE NOMINATED NODE READINESS GATES
customer-6948b8b959-zdlbz 2/2 Running 0 31h 10.131.2.7 ip-10-0-156-199.eu-central-1.compute.internal <none> <none>
preference-v1-7fdb89c86b-9kqvw 2/2 Running 0 31h 10.130.2.8 ip-10-0-132-217.eu-central-1.compute.internal <none> <none>
recommendation-v1-f484cbdb9-vzxgt 2/2 Running 0 31h 10.131.2.8 ip-10-0-156-199.eu-central-1.compute.internal <none> <none>In the previous case the preference IP is 10.130.2.8.
Then let’s sniff the traffic that is sent to preference pod by running:
kubectl sniff -i eth0 -o ./capture1.pcap customer-6948b8b959-zdlbz -f '((tcp) and (net 10.130.2.8))' -n tutorial -p -c istio-proxy...
ionSeconds:*300,},Toleration{Key:node.kubernetes.io/unreachable,Operator:Exists,Value:,Effect:NoExecute,TolerationSeconds:*300,},},HostAliases:[]HostAlias{},PriorityClassName:,Priority:*0,DNSConfig:nil,ShareProcessNamespace:nil,ReadinessGates:[]PodReadinessGate{},RuntimeClassName:nil,EnableServiceLinks:*true,PreemptionPolicy:*PreemptLowerPriority,Overhead:ResourceList{},TopologySpreadConstraints:[]TopologySpreadConstraint{},EphemeralContainers:[]EphemeralContainer{},},Status:PodStatus{Phase:Pending,Conditions:[]PodCondition{},Message:,Reason:,HostIP:,PodIP:,StartTime:<nil>,ContainerStatuses:[]ContainerStatus{},QOSClass:BestEffort,InitContainerStatuses:[]ContainerStatus{},NominatedNodeName:,PodIPs:[]PodIP{},EphemeralContainerStatuses:[]ContainerStatus{},},}
INFO[0000] waiting for pod successful startup
INFO[0004] pod: 'ksniff-jskvq' created successfully on node: 'openshift-fzg94-worker-b-q5kr9.c.rhd-devx-asotobue.internal'
INFO[0004] executing command: '[chroot /host crictl inspect --output json 4af99eeb1e4de09f9ba632516375f86c5959227b15d1fe5146105ee9a10641e6]' on container: 'ksniff-privileged', pod: 'ksniff-jskvq', namespace: 'tutorial'
INFO[0004] command: '[chroot /host crictl inspect --output json 4af99eeb1e4de09f9ba632516375f86c5959227b15d1fe5146105ee9a10641e6]' executing successfully exitCode: '0', stdErr :''
INFO[0004] output file option specified, storing output in: './capture5.pcap'
INFO[0004] starting remote sniffing using privileged pod
INFO[0004] executing command: '[nsenter -n -t 963456 -- tcpdump -i eth0 -U -w - ((tcp) and (net 10.131.2.143))]' on container: 'ksniff-privileged', pod: 'ksniff-jskvq', namespace: 'tutorial'Change the customer pod name with the correct one and the IP with the preference IP.
So now go to a new terminal window and execute:
customer => preference => recommendation v1 from 'recommendation-v1-b87789c58-mfrhr': 2Then move to kubectl sniff terminal window and stop the process by typing kbd:[Ctrl+C].
At the same directory, you have a file named capture1.pcap which is the captured traffic, you can use Wireshark to open the file, and you’ll see something like:
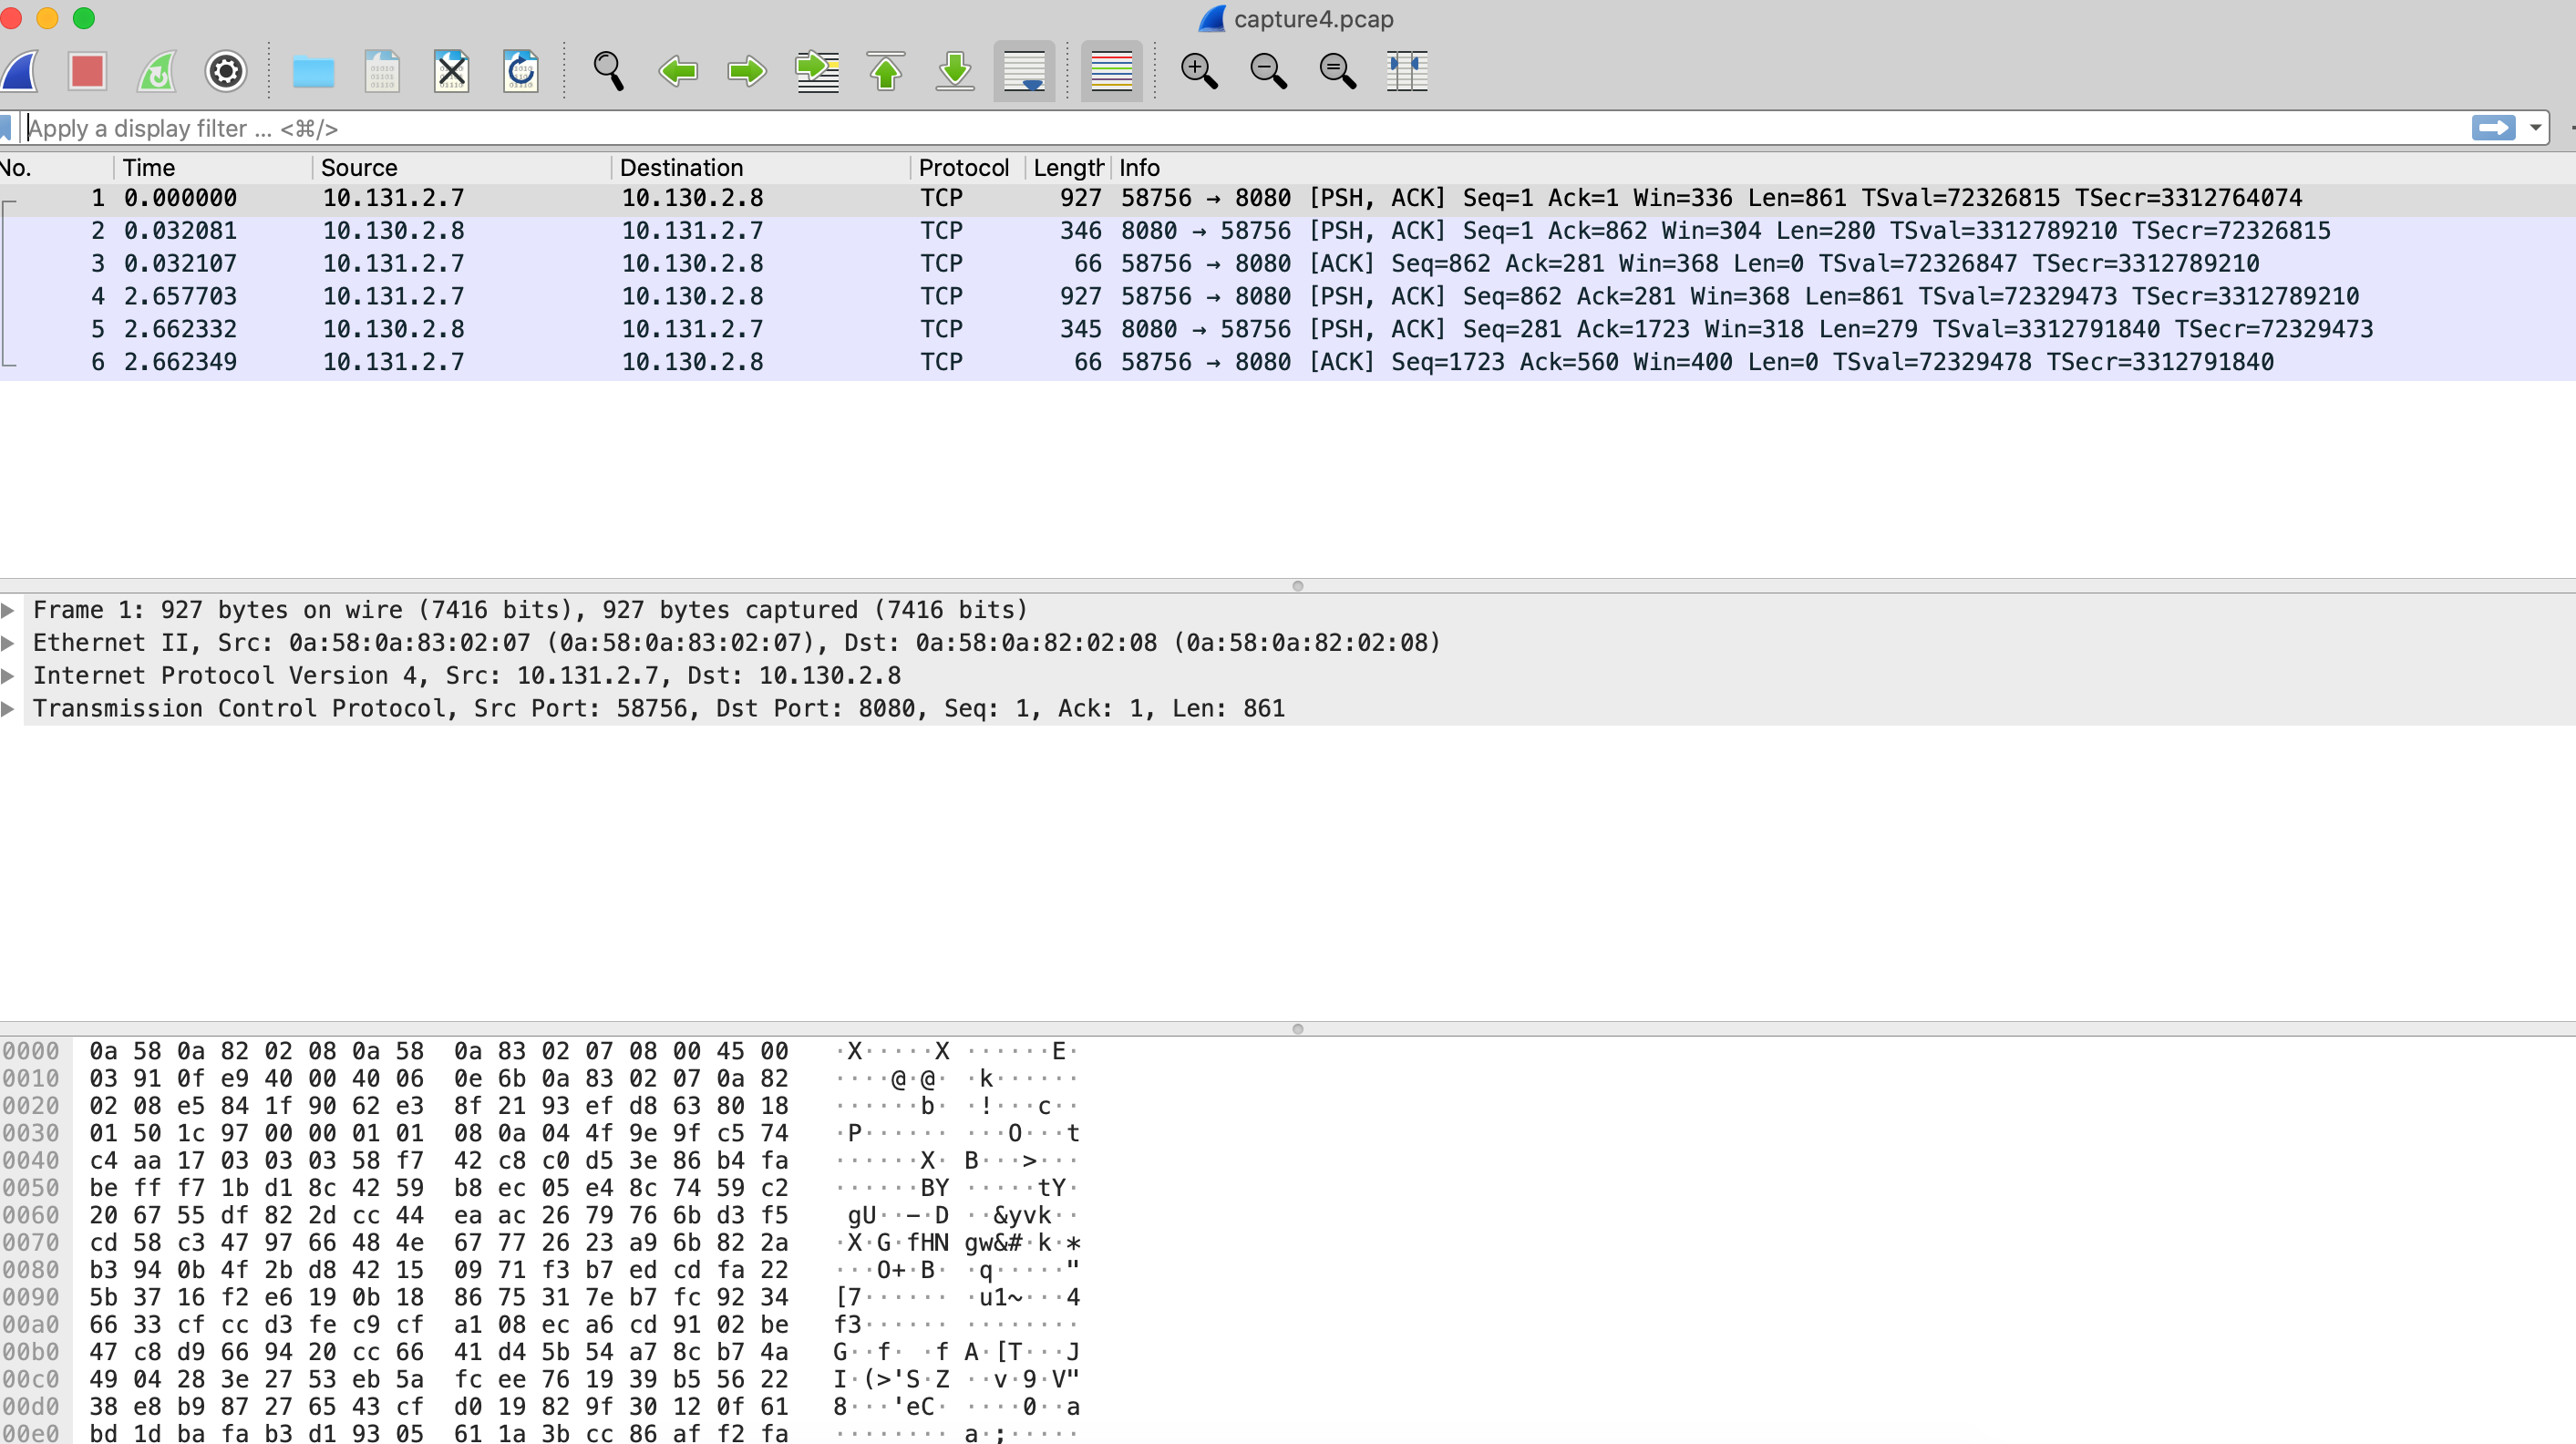
Notice that there is no HTTP traces, the reason is that HTTPS is not traced by default, you only see at TCP level.
But now let’s disable mTLS and see what’s happening:
kubectl replace -f istiofiles/disable-mtls.ymlStart ksniff changing the pcap filename:
kubectl sniff -i eth0 -o ./capture2.pcap customer-6948b8b959-zdlbz -f 'tcp) and (net 10.130.2.8' -n tutorial -p -c istio-proxyAnd execute again:
customer => preference => recommendation v1 from 'recommendation-v1-b87789c58-mfrhr': 2Then move to kubectl sniff terminal window and stop the process by typing kbd:[Ctrl+C].
At the same directory, you have a file named capture2.pcap which is the captured traffic, you can use Wireshark to open the file, and you’ll see something like:
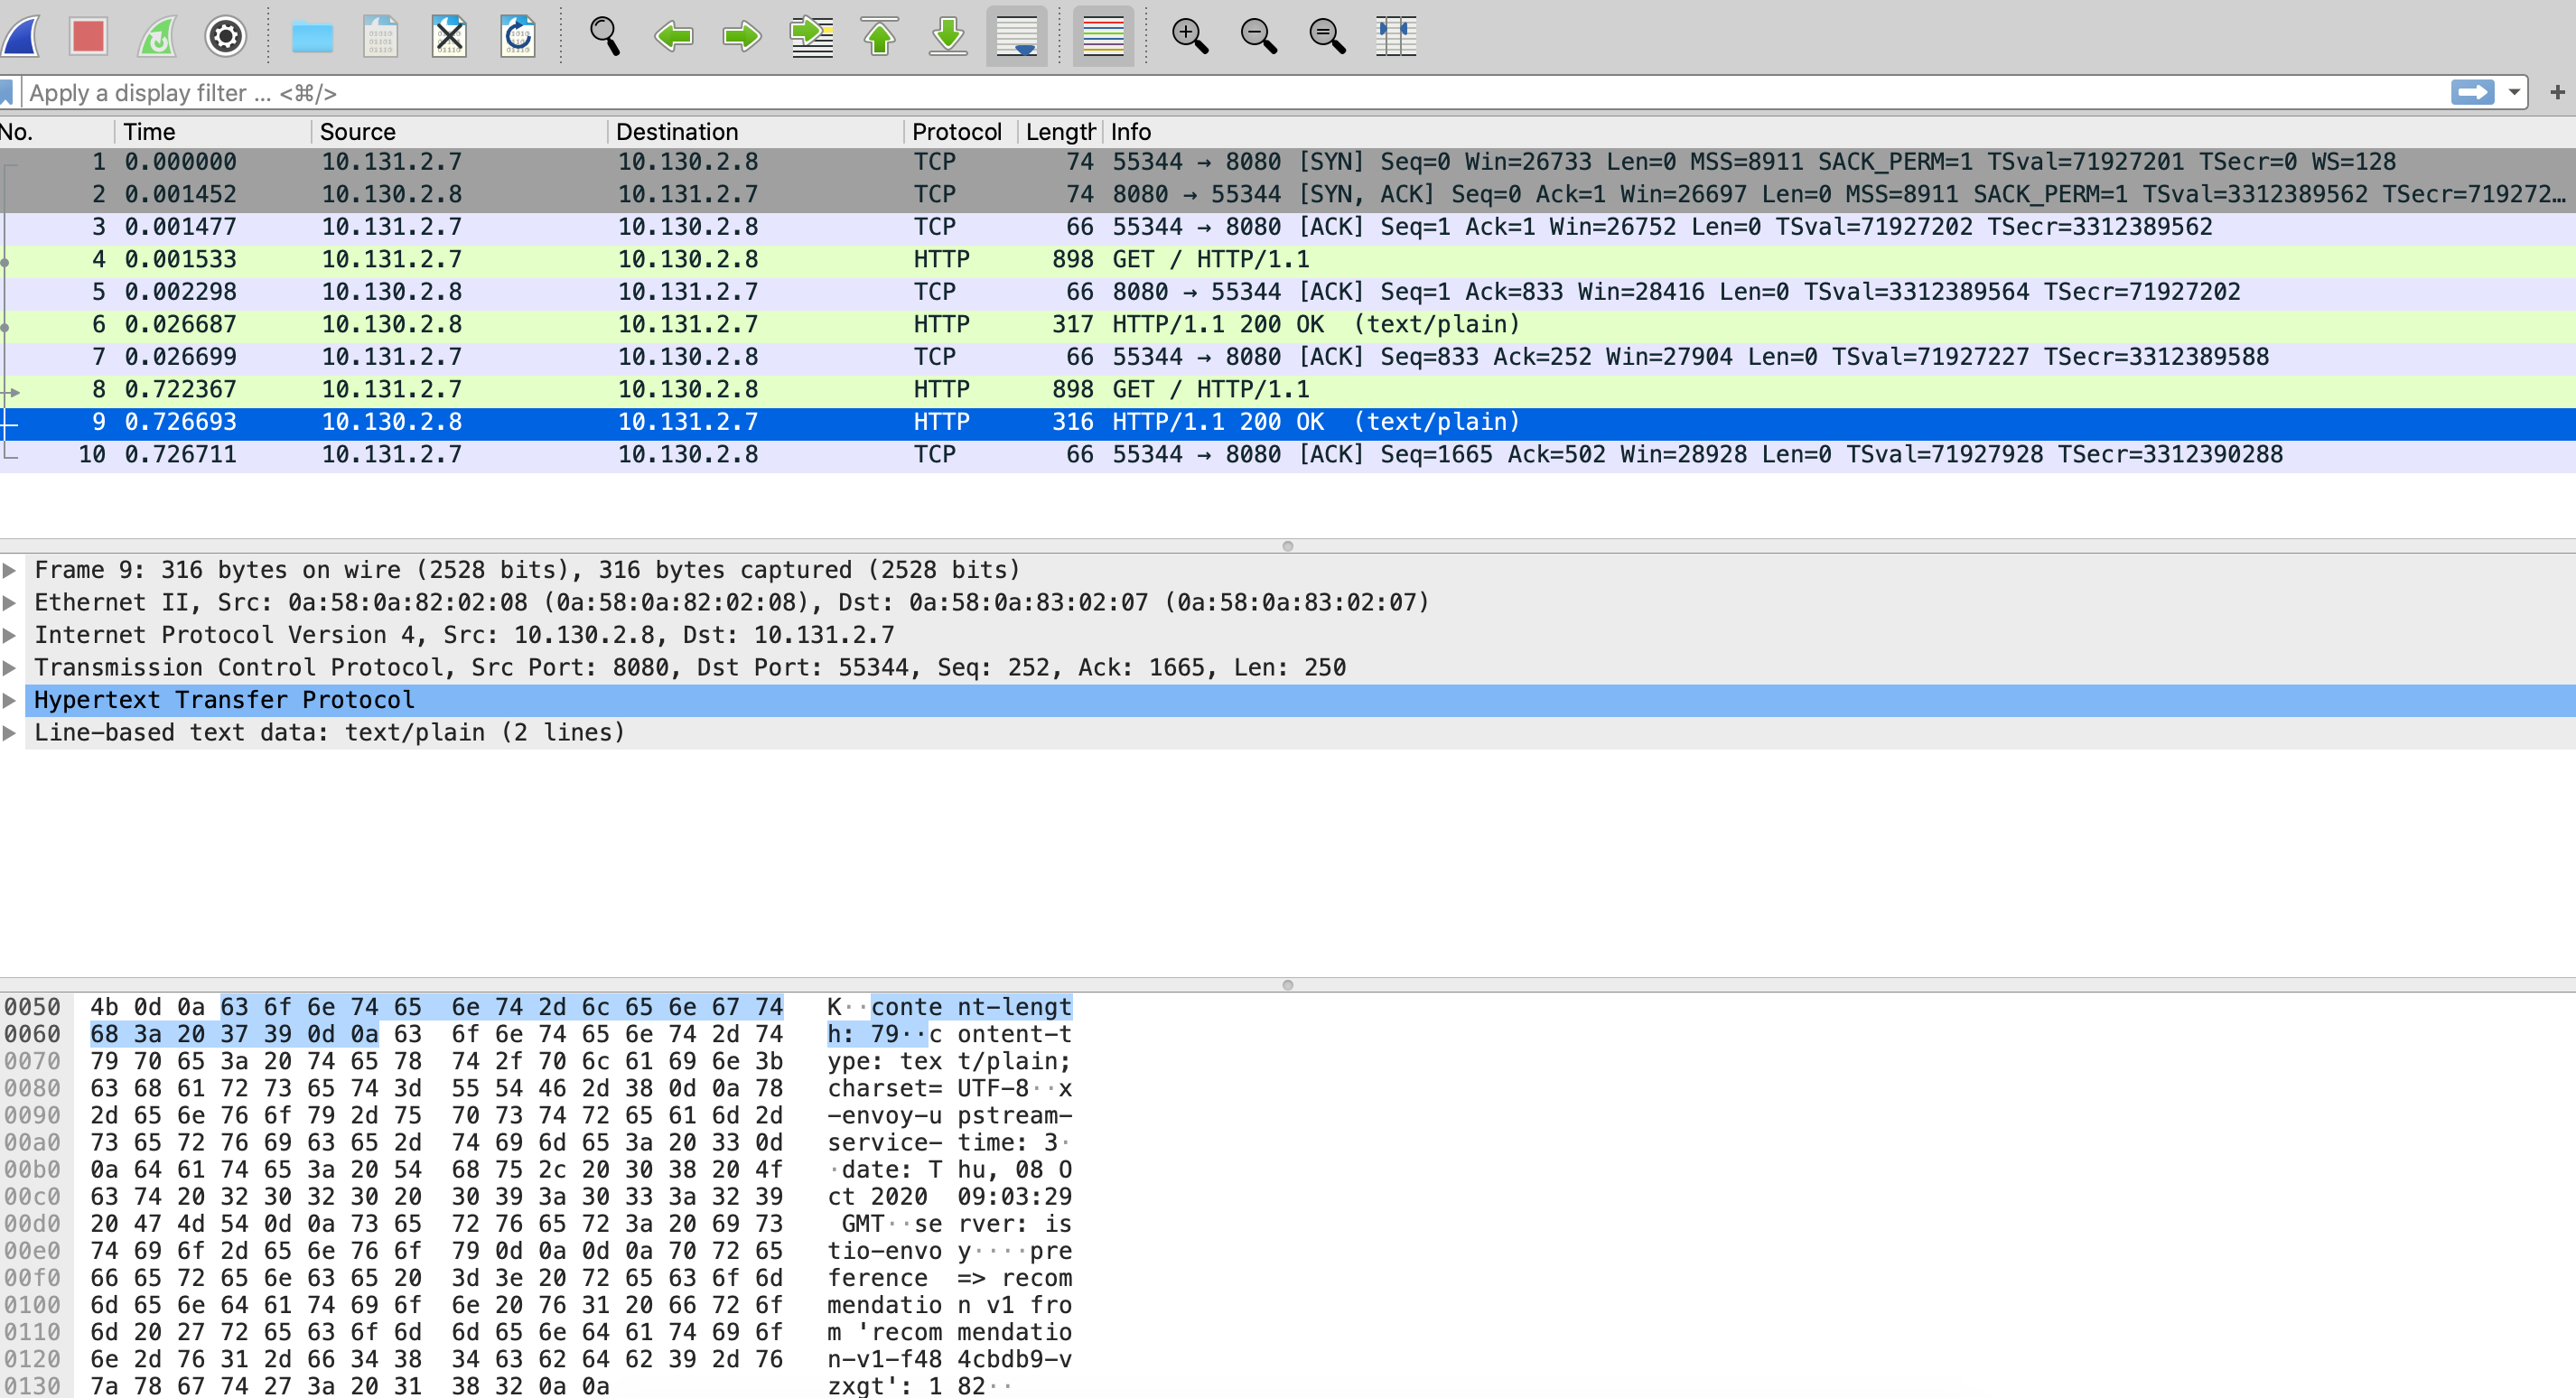
Notice that now HTTP traffic is shown and if you look at the bottom, you’ll see the response content.