Debugging Apps
Background: Port Forwarding and Debugging
Just as we did before with remote shelling into our pods, we can also set up a port-forward between our local machine and our pod. The is useful for operations like connecting to a database running in a pod, viewing an administrative web interface we don’t want to expose to the public, or, in our case, attaching a debugger to the JVM running our application server.
You can read more about port-forwarding from the developer documentation.
By port forwarding the debugging port for the application server, we can attach the debugger from our IDE and actually step through the code in the pod as it is running in real time. By default EAP is not in debug mode, therefore we first need to turn on the debug ports
Exercise: Enabling Debugging in EAP on OpenShift
It is very simple to turn on debugging. The EAP S2I container we are using is looking for an environment variable to control whether or not to enable the debug port. All we need to do is set an environment variable for the deployment.
oc set env dc/mlbparks DEBUG=trueThis will force a redeploy of our MLBparks pod, this time with the JDWT transport enabled and serving on port 8787.
Exercise: Port-Forwarding from the pod to our local machine
It is quite simple to do port-forwarding.
First get the pods:
oc get podsNAME READY STATUS RESTARTS AGE
jenkins-1-deploy 0/1 Completed 0 4d19h
jenkins-1-l2g2c 1/1 Running 0 4d19h
mlbparks-1-build 0/1 Completed 0 4d
mlbparks-1-deploy 0/1 Completed 0 4d
mlbparks-1-hook-post 0/1 Completed 0 4d
mlbparks-2-build 0/1 Completed 0 10m
mlbparks-2-deploy 0/1 Completed 0 9m49s
mlbparks-2-hook-post 0/1 Completed 0 8m59s
mlbparks-3-deploy 1/1 Running 0 25s
mlbparks-3-hcd8g 0/1 Running 0 10s
...Now we can set to set up the port-forward:
oc port-forward mlbparks-3-hcd8g 8787:8787We said to port-forward from port 8787 on the pod to 8787 on the local machine. Now we can attach a remote debugger.
| To stop port-forwarding just hit ctrl-c in the terminal window where you did the port forward command |
Setting up Remote Debug in IntelliJ
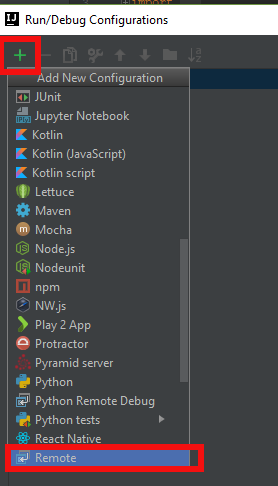
Setting up remote debugging is quite easy in IntelliJ. First edit the run/debug configurations. Under the Run menu (alt-u), choose edit configurations. This will bring up the new configuration dialog.
Click the plus in the top left corner, scroll down, and choose remote.

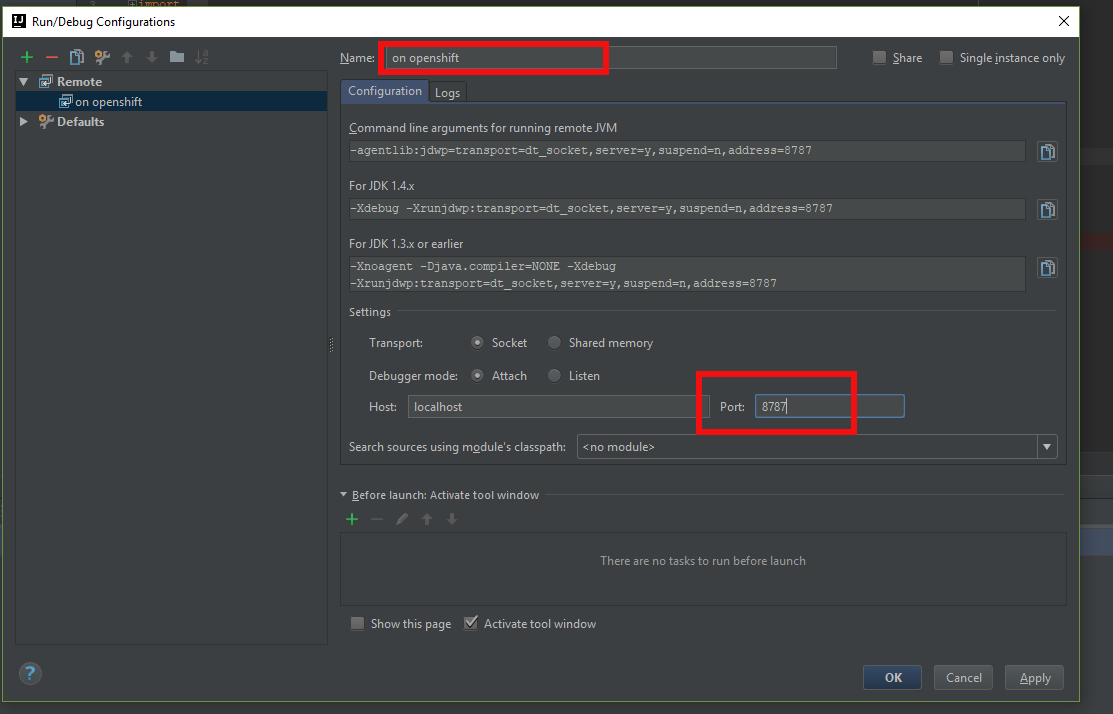
On the resulting dialog page, change the name at the top to "on OpenShift" or whatever is informative to you. Then towards the bottom right, change the port number to 8787. When you have done that click "OK".

Now when you click the Debug icon in IntelliJ, it will open the debugger and attach to JVM in the pod on OpenShift. Go ahead and set a break point in any class you want and it will do normal debugging - just like you know and love!