Chaos Experiment 1: Network latency
30 MINUTE PRACTICE
In production, it is more common to have slow services than broken services. Latency measures the delay between an action and a response. For this first experiment, we will test the following hypothesis:
A small network latency should not impact the Service Level Objective (SLO) of the Travel Service
Define the steady state
In the Chaos Engineering Dashboard, you can analyze the different metrics and define the Steady State for our chaos experiment.
First, select the following variables on the dashboard:
| Parameter | Value | Description |
|---|---|---|
Namespace |
chaos-engineering%USER_ID% |
|
Service |
travels.chaos-engineering%USER_ID%.svc.cluster.local |

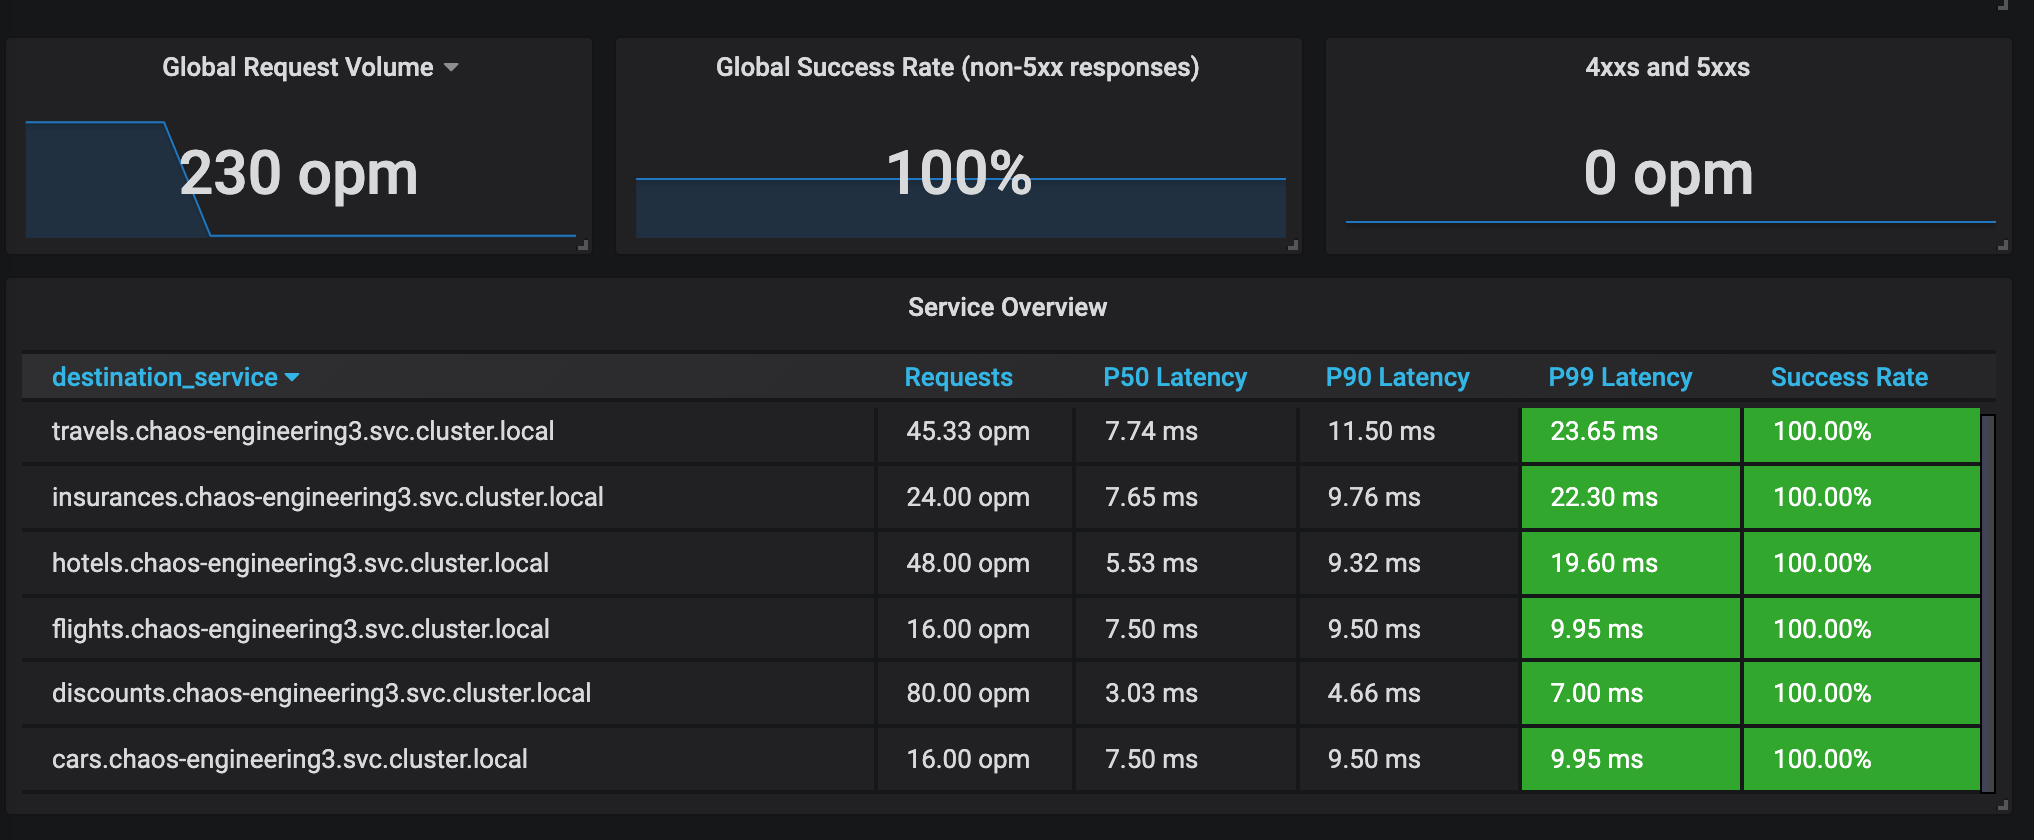
From the Namespace section, you can tell that 99% of requests are successful and served within 50 ms
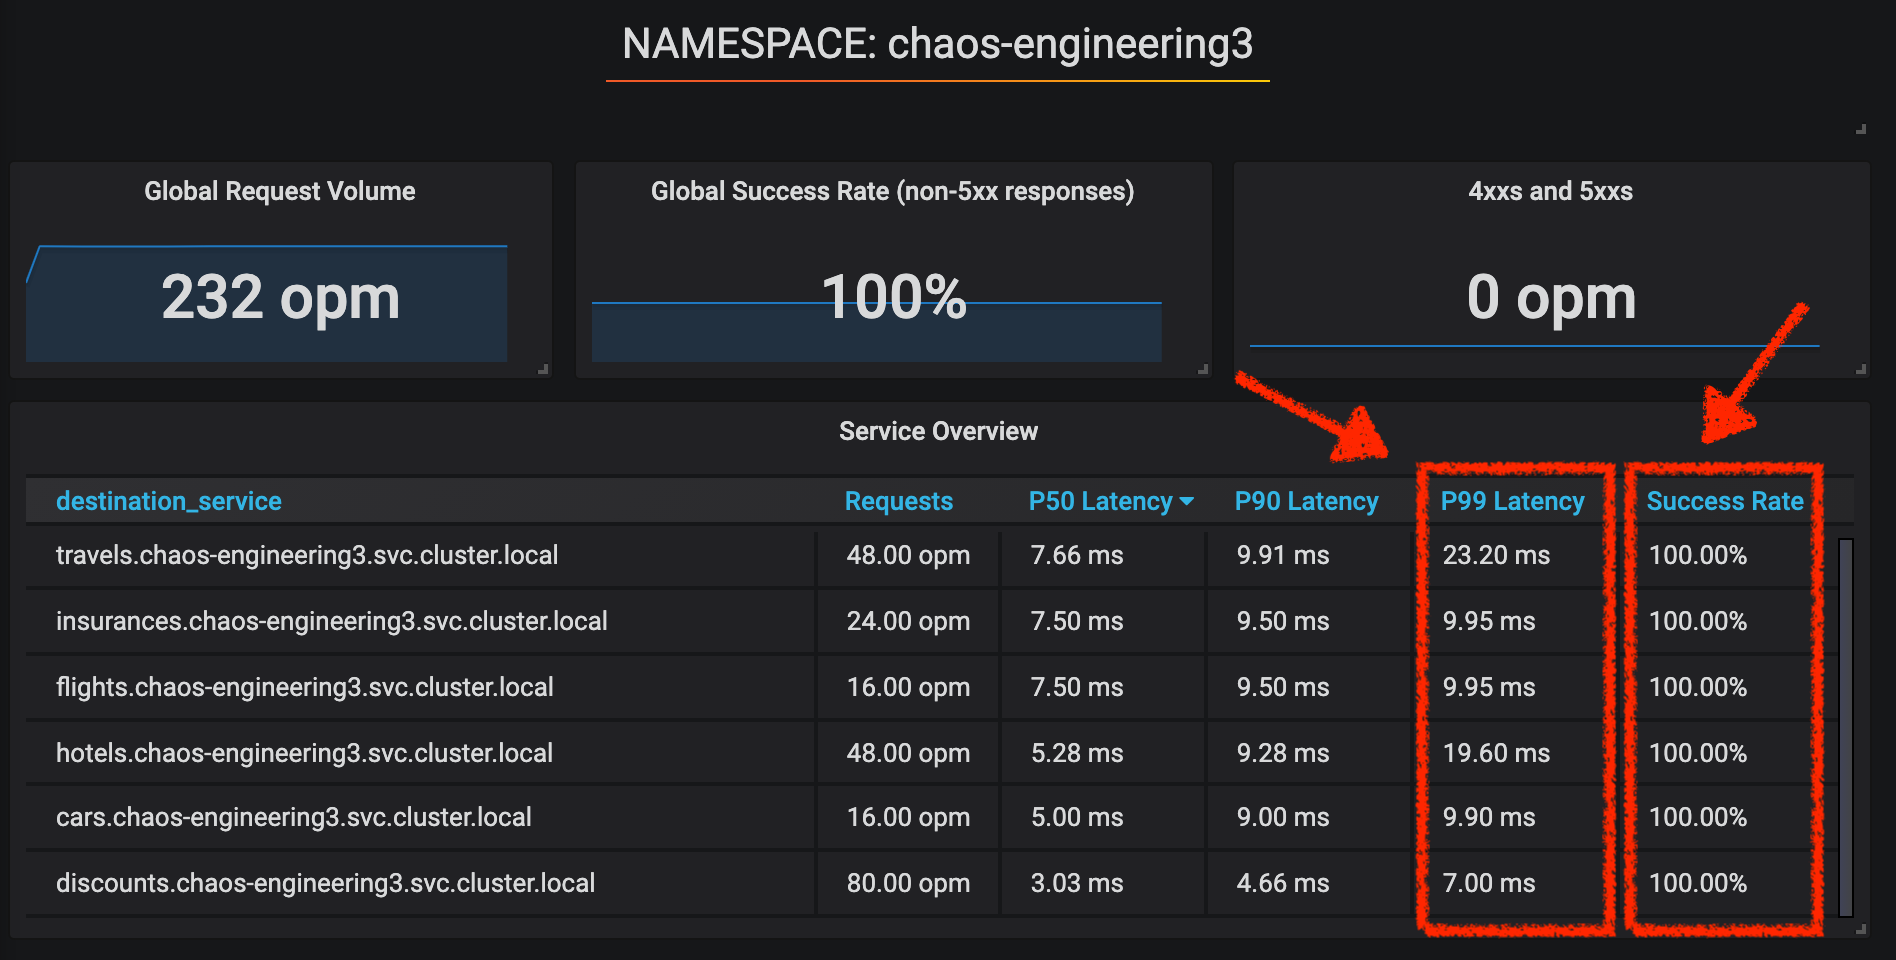
So we will define this SLO as "steady-state".
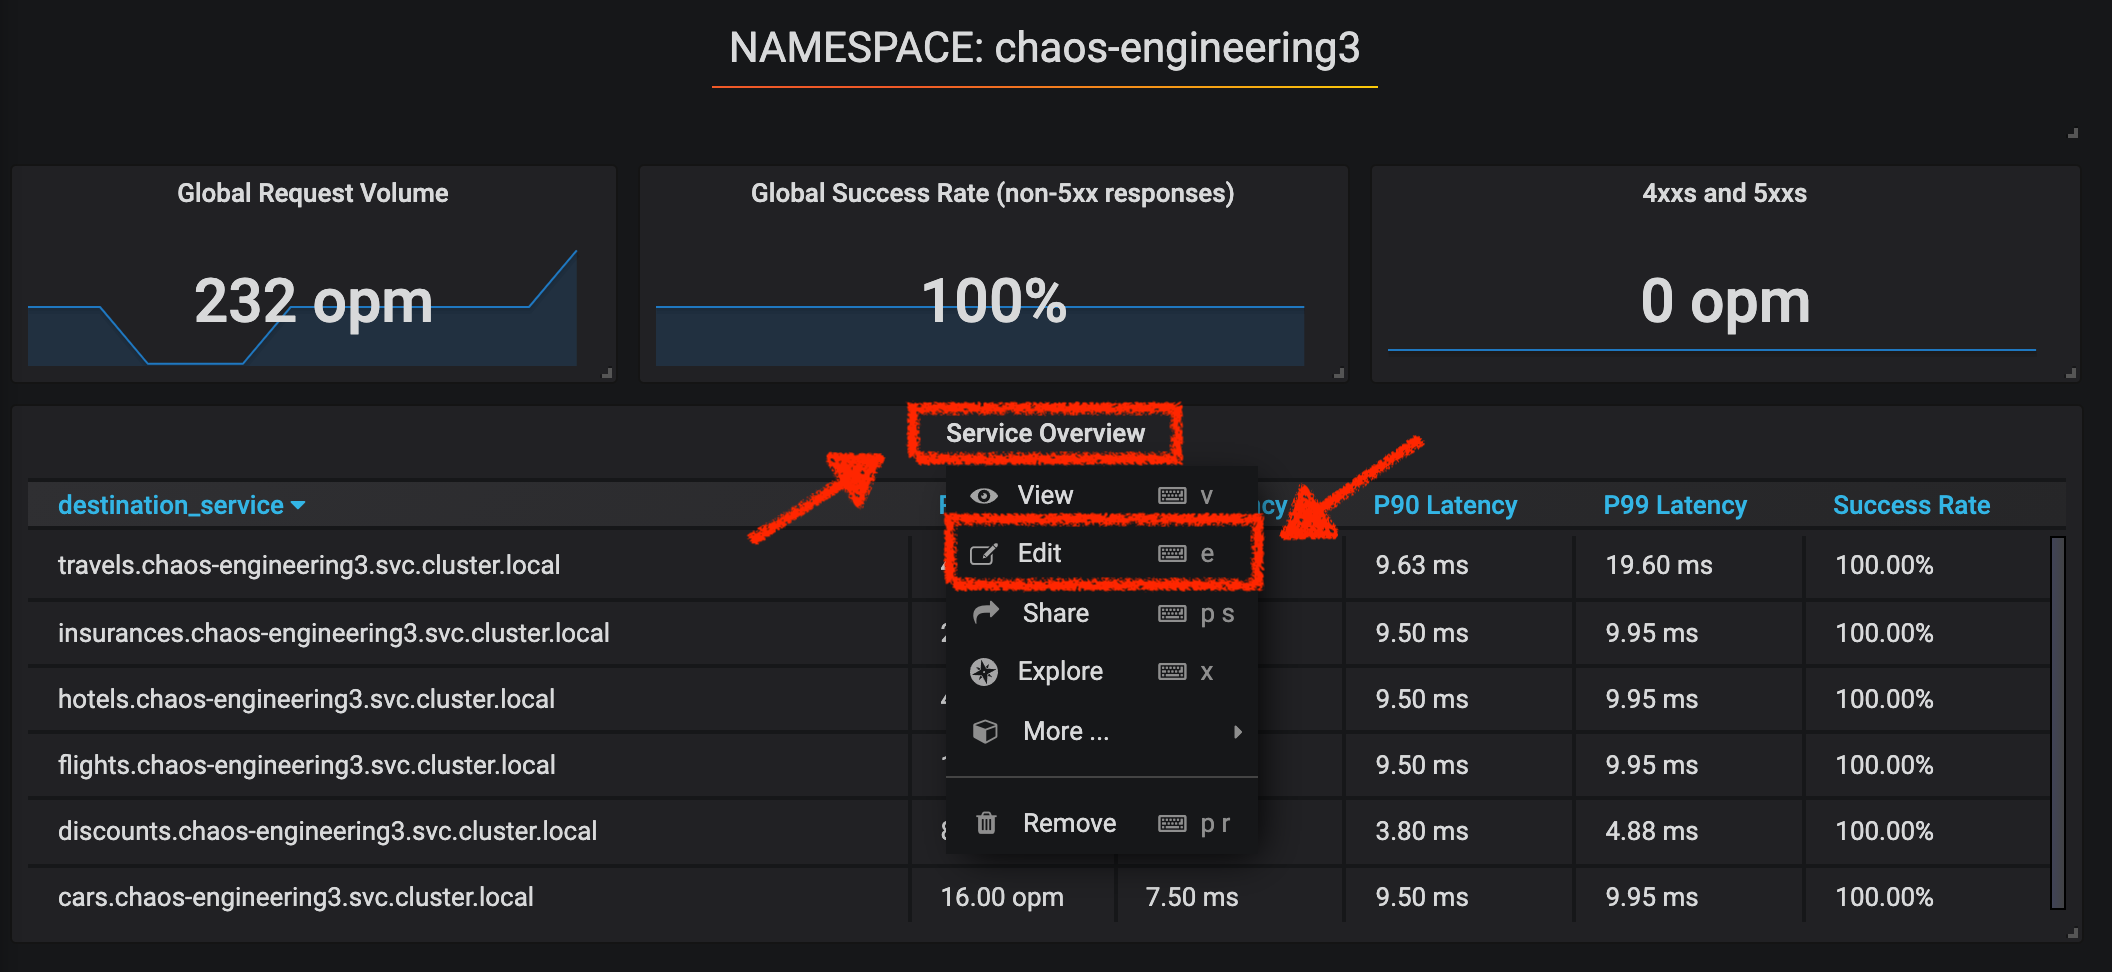
Click on 'Service Overview' > Edit
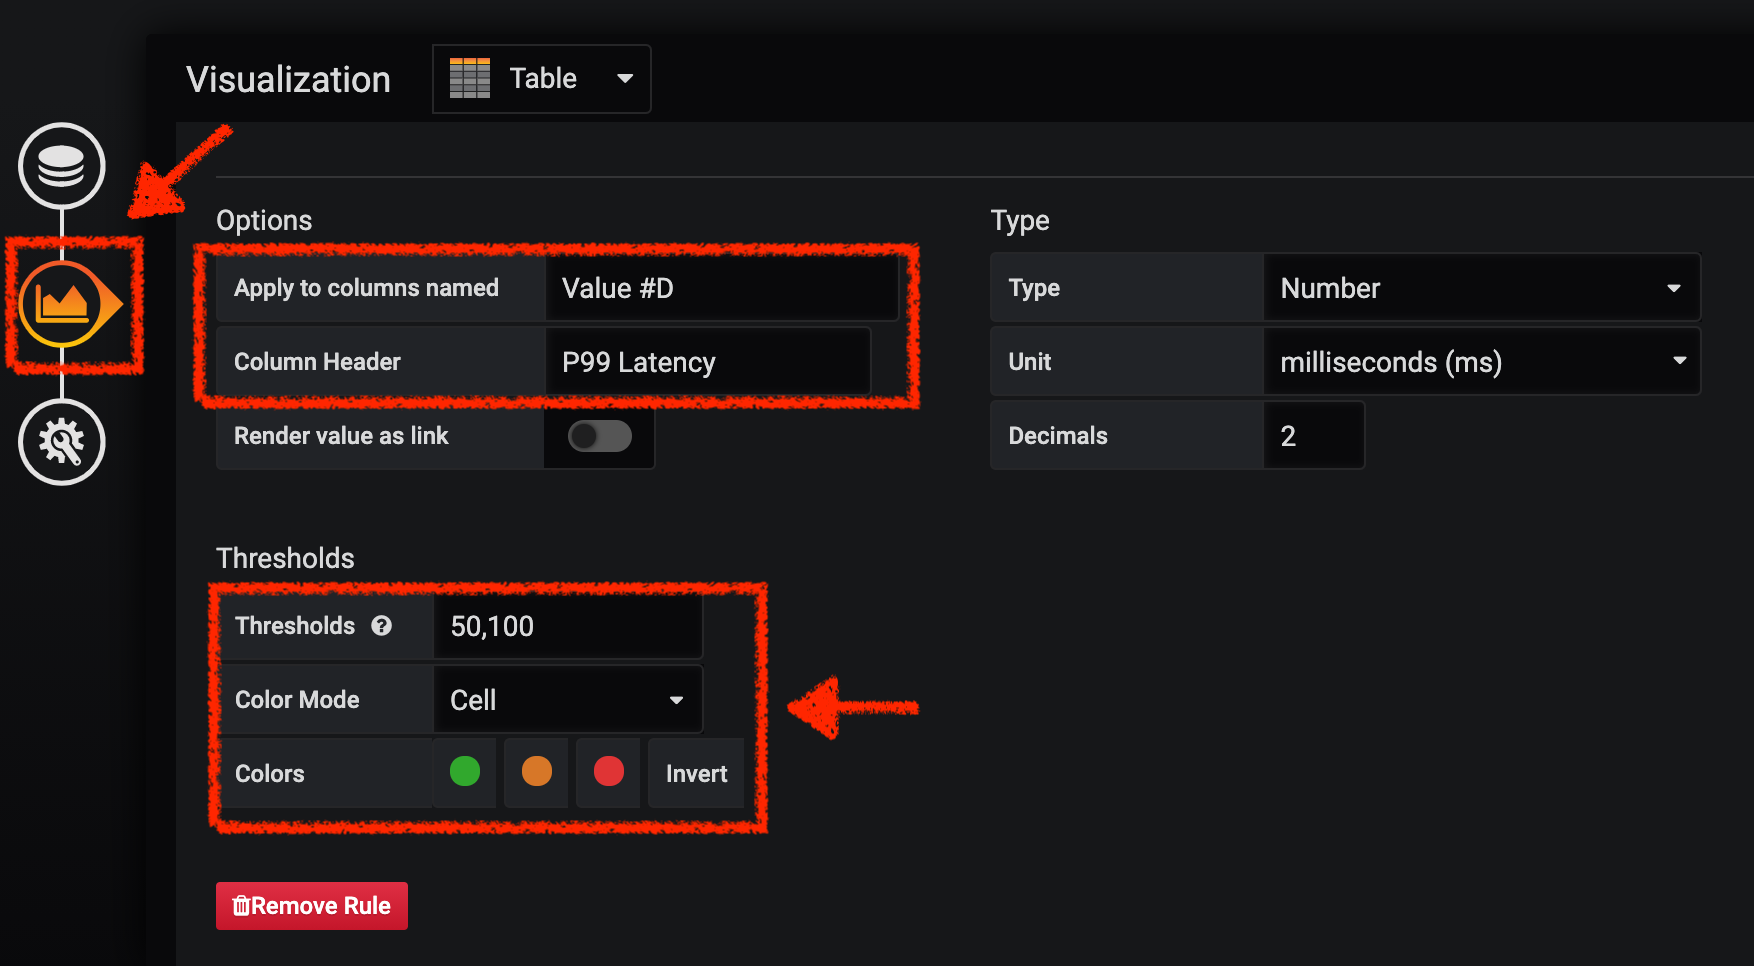
Then, click on 'Visualization Settings' icon on the left hand sidebar, scroll down to find the 'P99 Latency (Value #D)' rule and enter the following information for Thresholds
| Parameter | Value | Description |
|---|---|---|
Thresholds |
50,100 |
|
Color Mode |
Cell |
|
Colors |
Green/Yellow/Red (click on the 'invert' button if needed) |
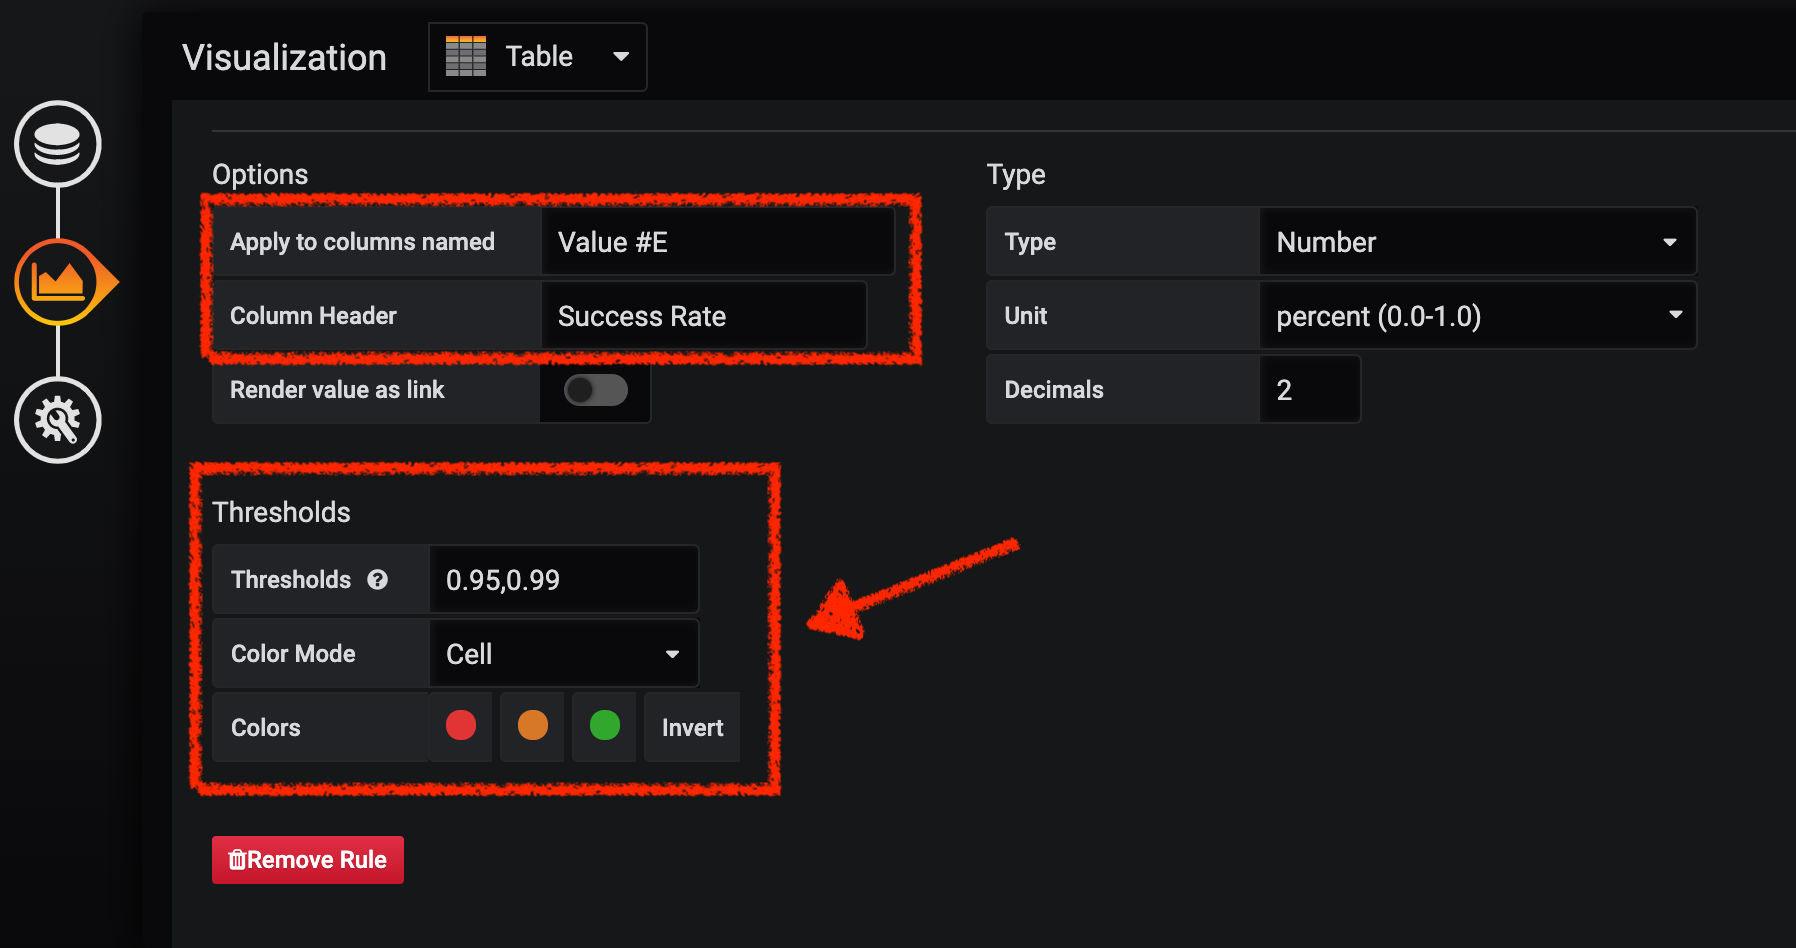
Scroll down again and to find the 'Success Rate (Value #E)' rule and enter the following information for Thresholds
| Parameter | Value | Description |
|---|---|---|
Thresholds |
0.95,0.99 |
|
Color Mode |
Cell |
|
Colors |
Red/Yellow/Green (click on the 'invert' button if needed) |
Once done, you should have the following outcome (all green).

Click on the 'Disk' icon to save and go back to the Dashboard.
Run the Chaos experiment
In the Kiali Console, from the 'Graph' view, right-click on the 'discounts' service (triangle symbol) and select 'Details'
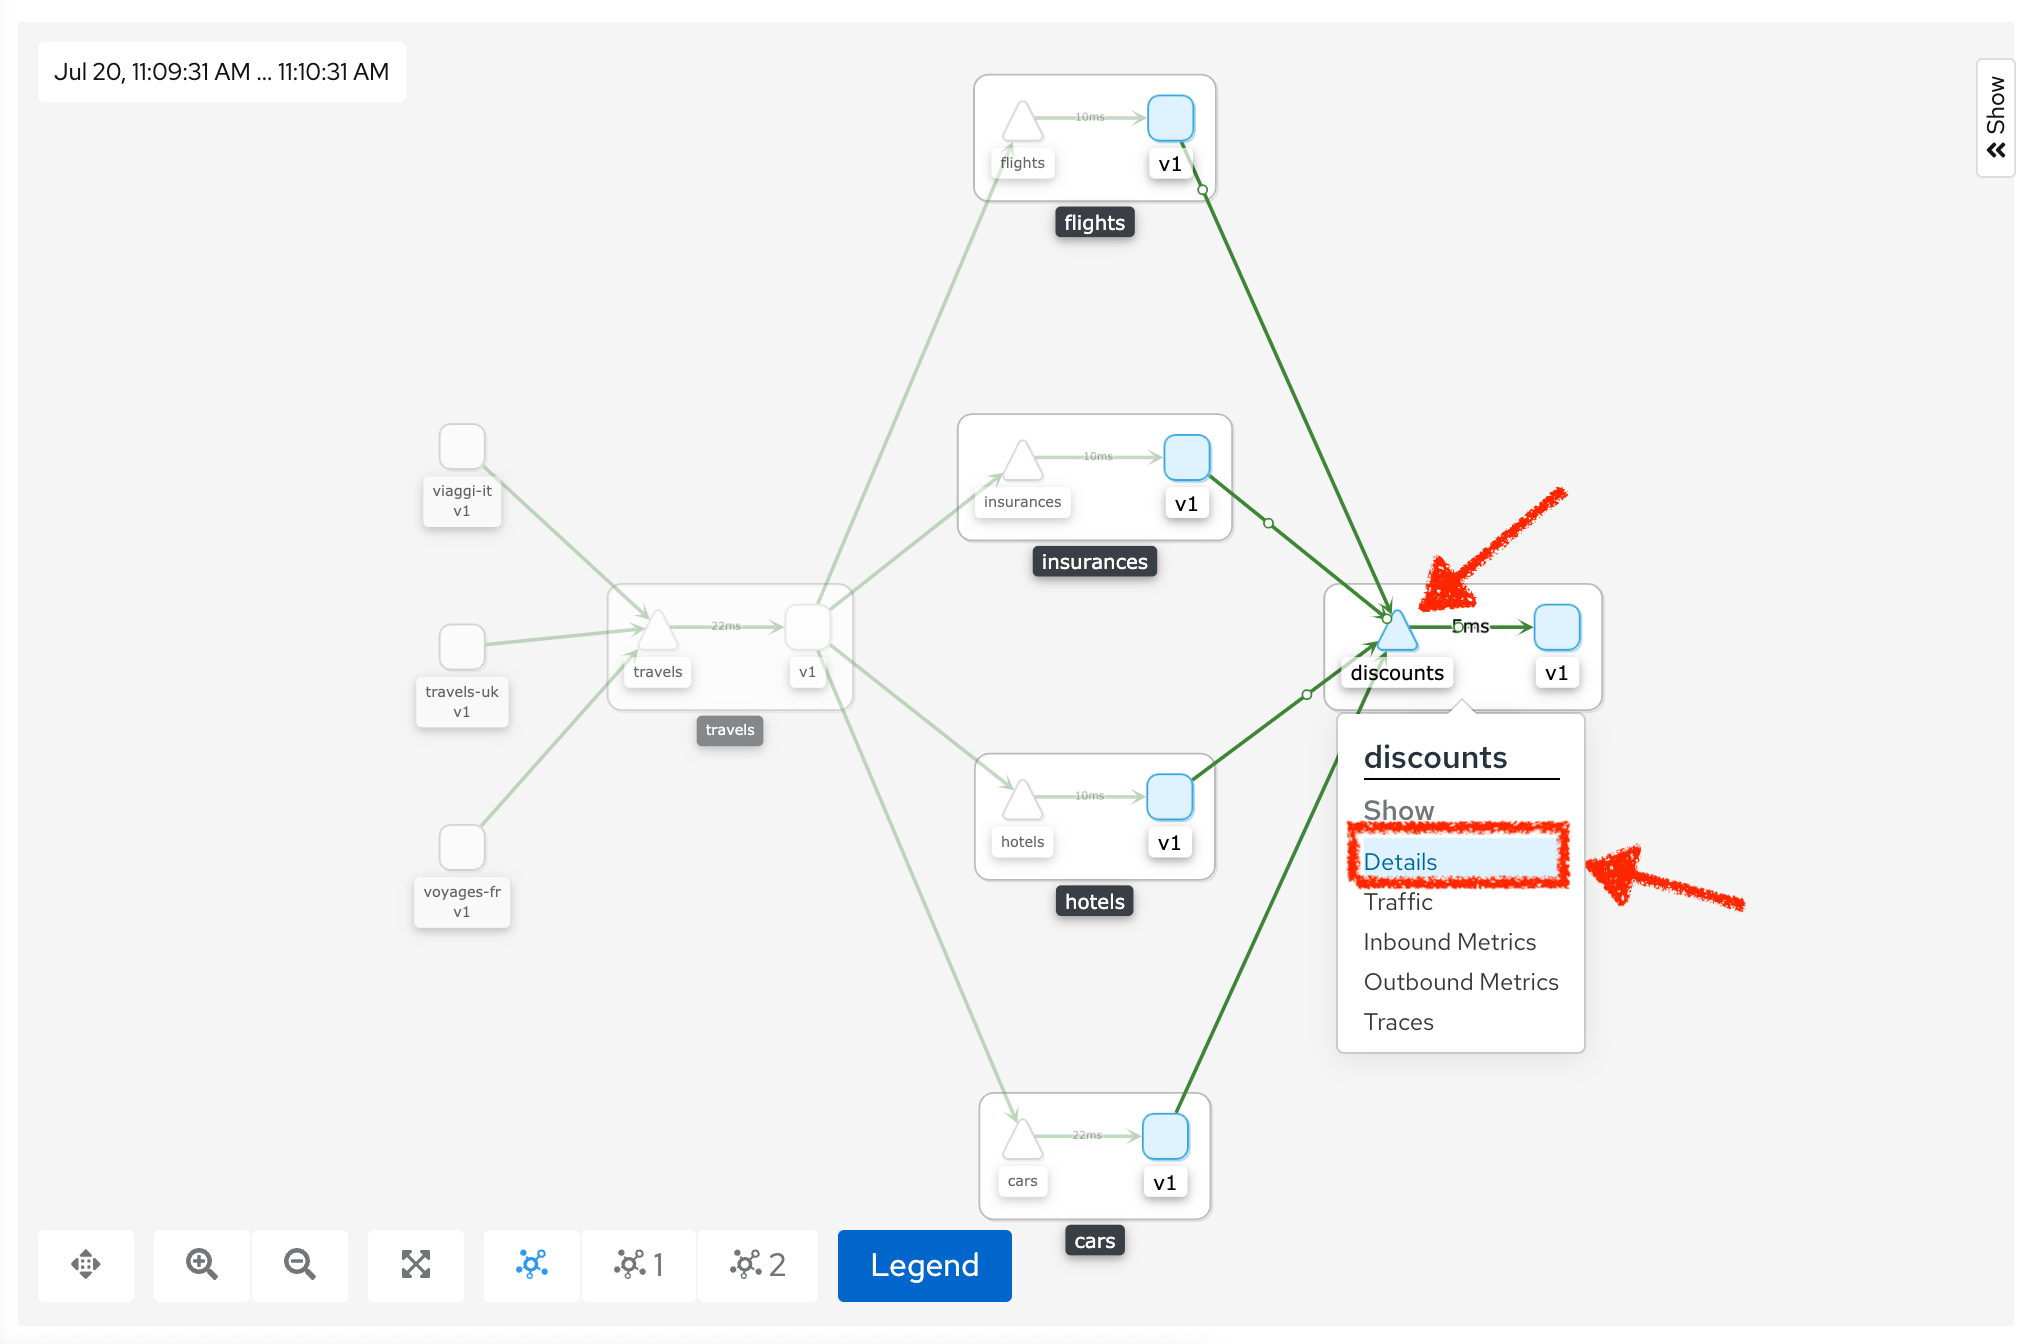
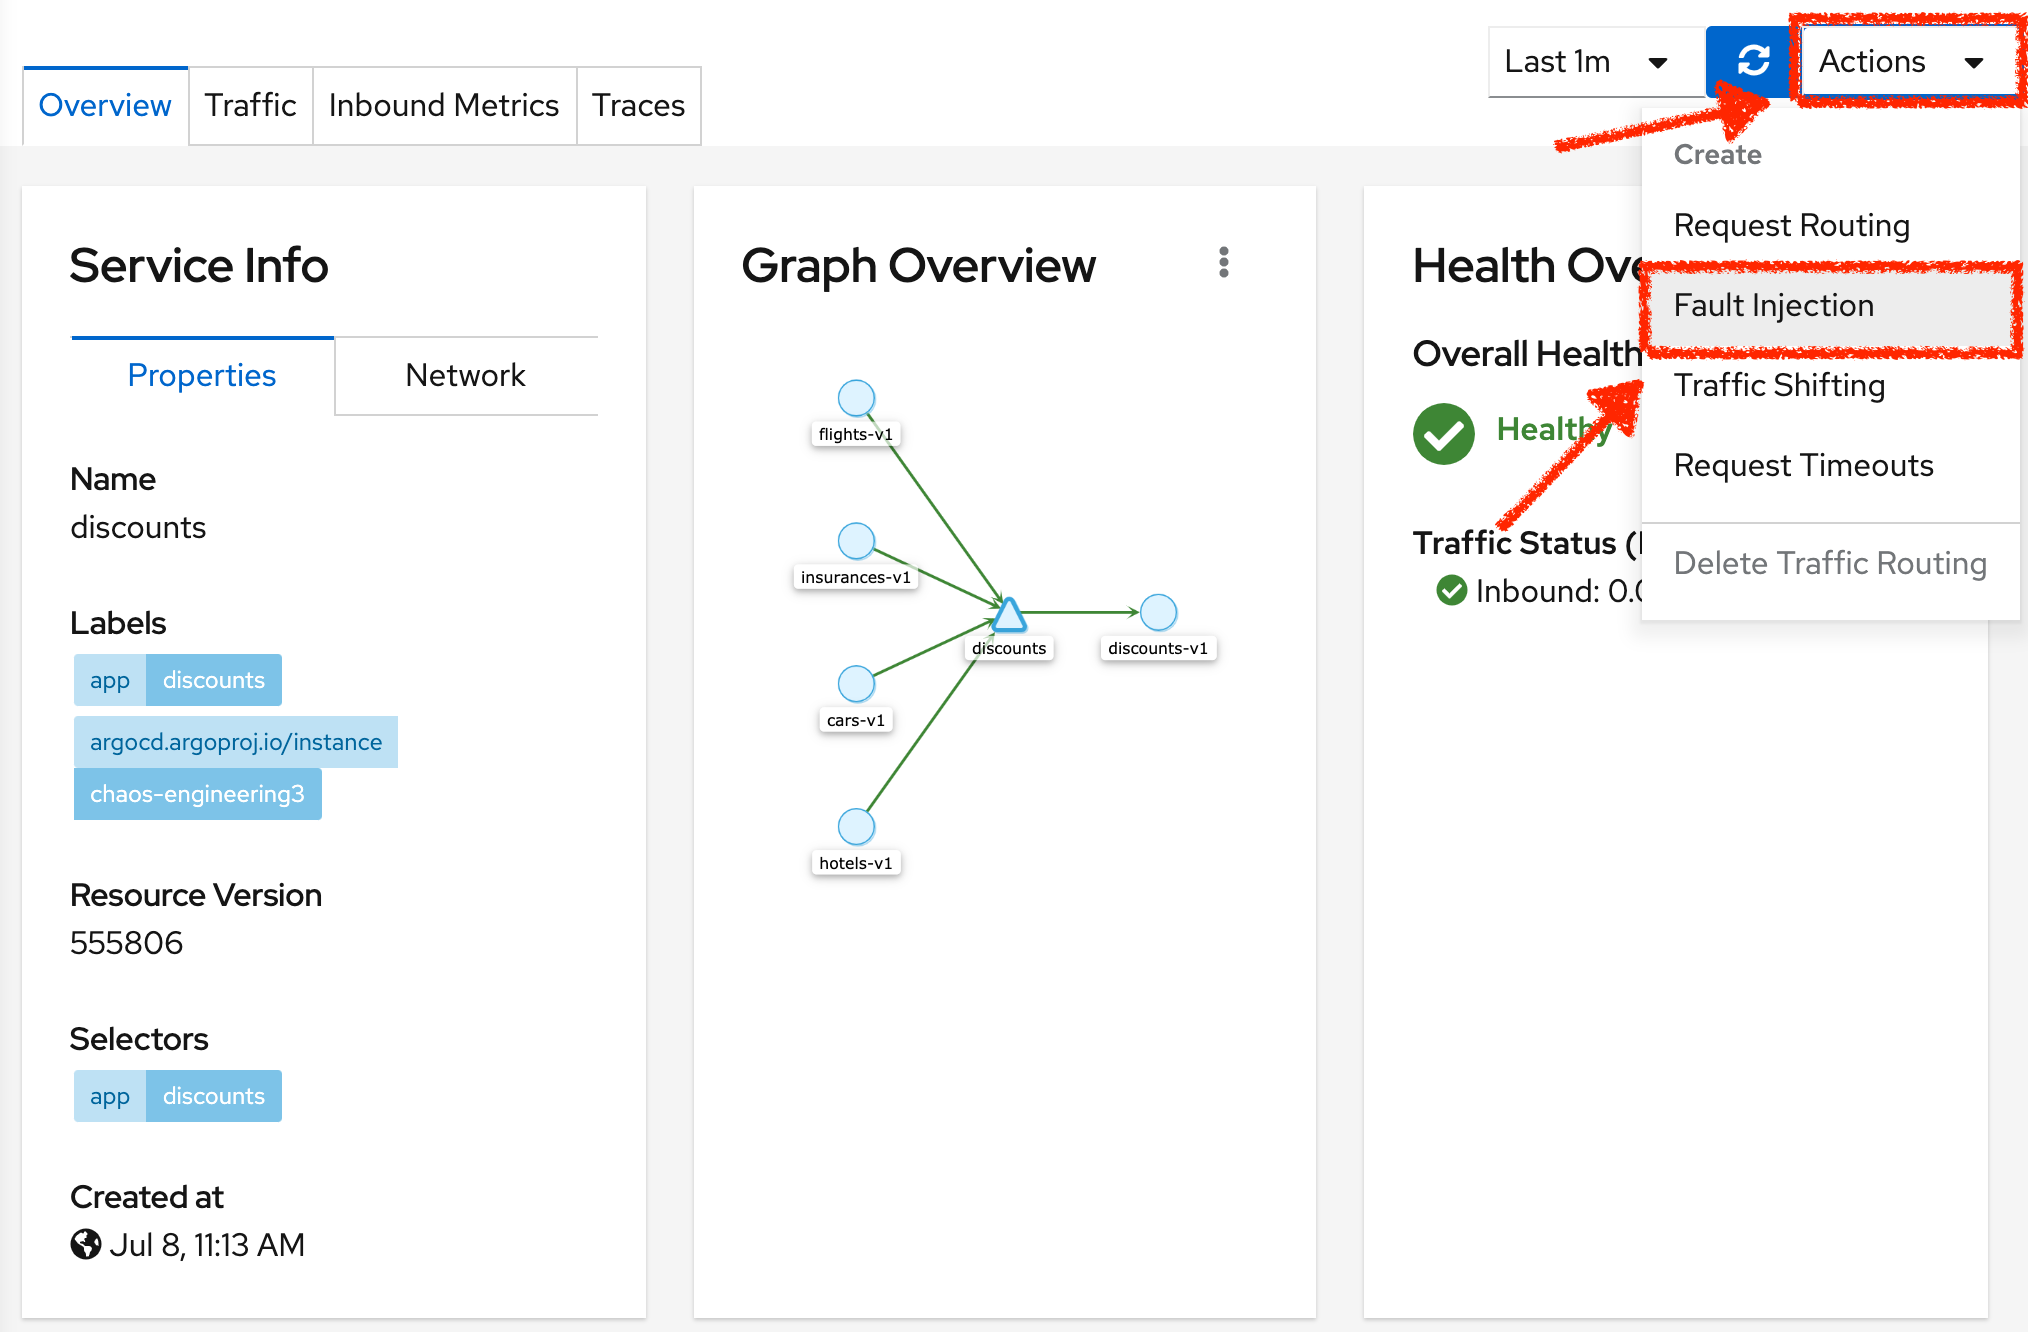
You will be redirected to the Service Details page.
Click on the 'Actions' > 'Fault Injection'
Add HTTP Delay by entering the following settings:
| Parameter | Value | Description |
|---|---|---|
Add HTTP Delay |
Enabled |
|
Delay Percentage |
5 |
|
Fixed Delayed |
1s |
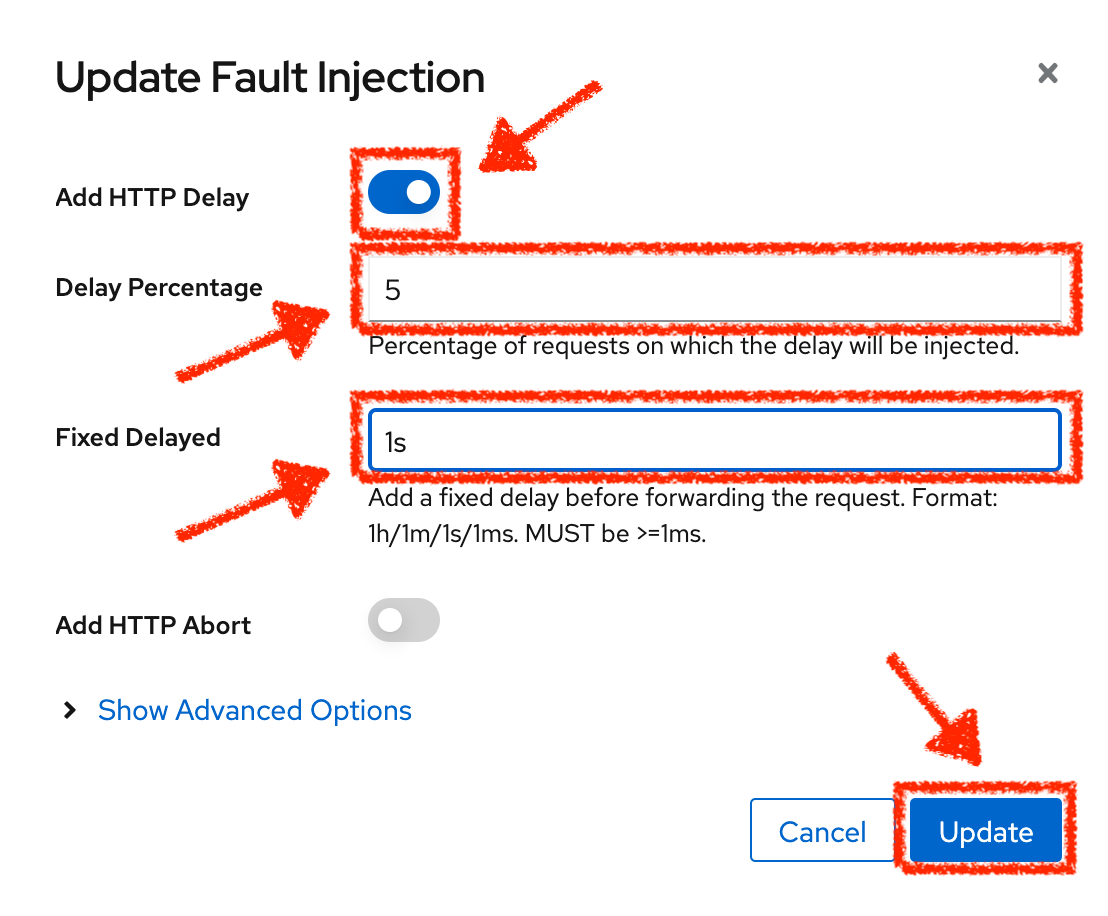
Click on the 'Update' button.
5% of the traffic of the 'discounts' service has now 1 second of delay.
Analyze the Chaos outcome
Now let’s see the impact of the application.
In the Chaos Engineering Dashboard, you can see the result of the chaos experiment.

From the 'Service Overview' panel or 'Request Duration' for the 'travels' service, you can tell the following about the small network latency based on our hypothesis:
-
there is no impact on the Success Rate of the overall requests (100%)
-
there is a huge impact on the performance of the application.
Indeed, just 1 second of delay on 5% of the traffic of one dependant service induces a latency propagation of ~2 seconds across the entire system.
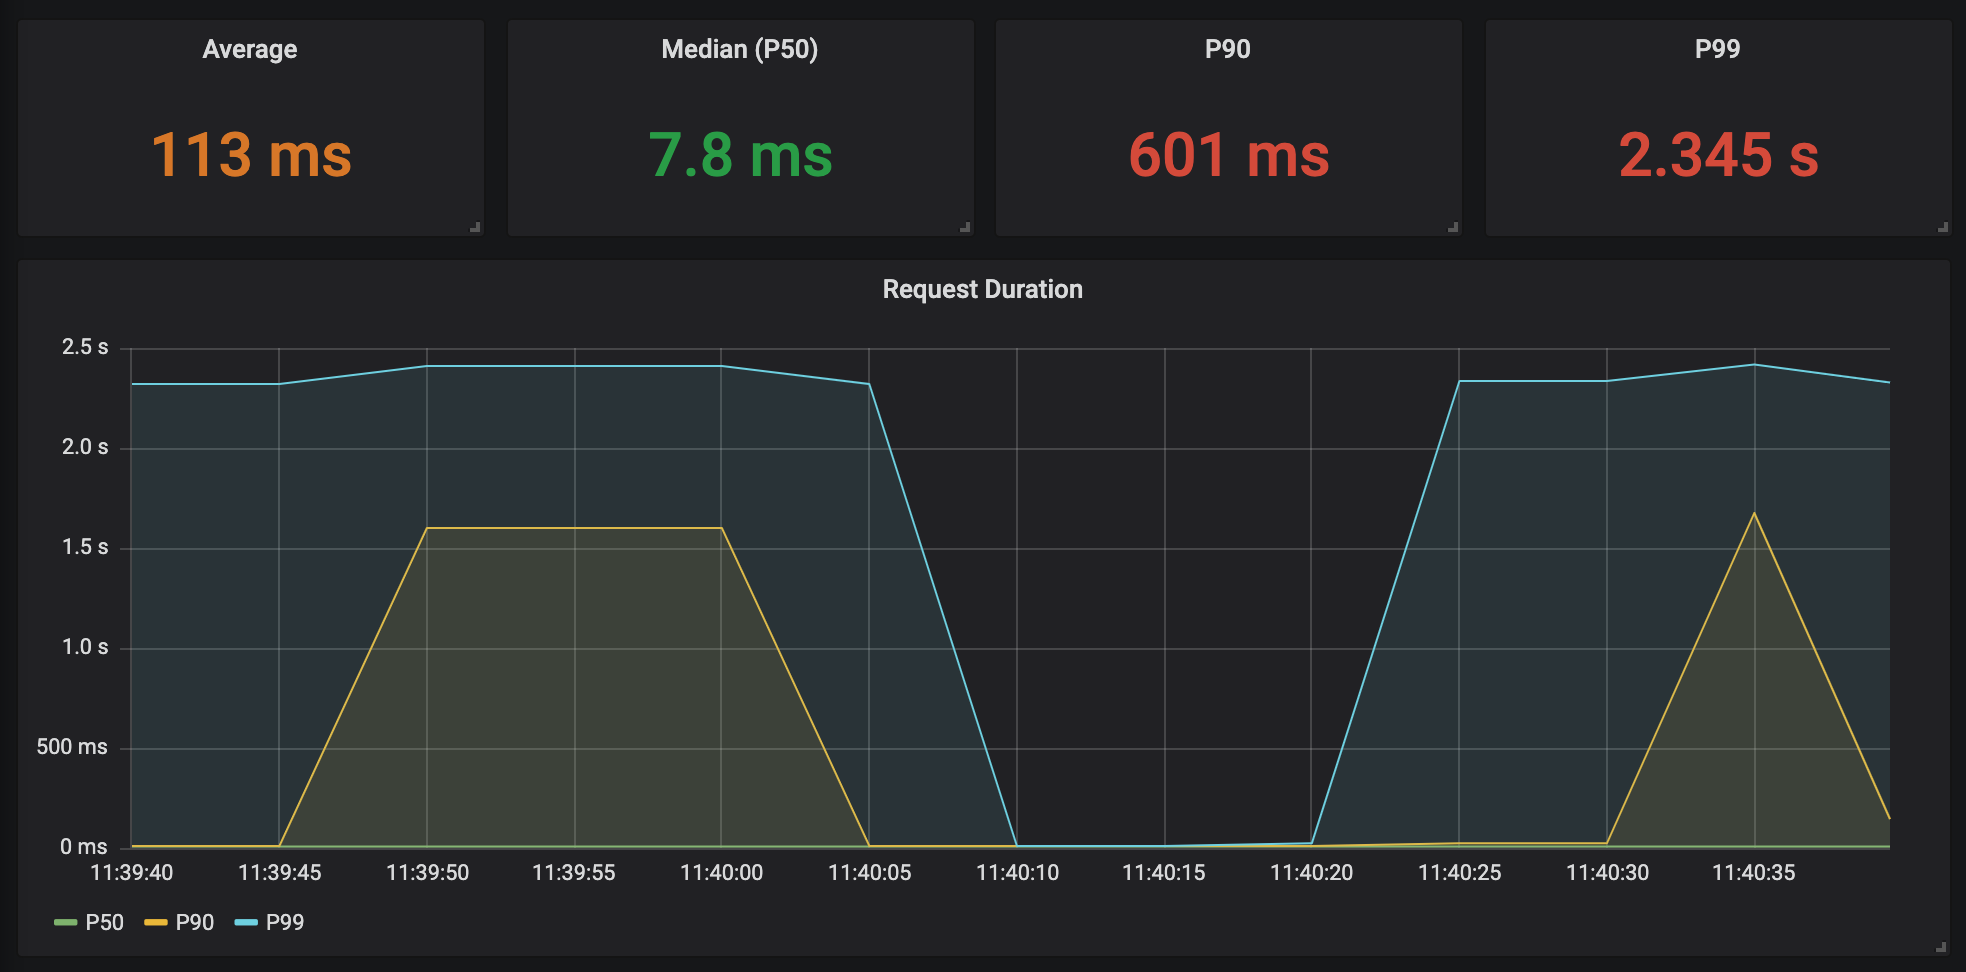
In conclusion, you can tell the application is not resilient to a small network latency. To reduce or fix this phenomenon, you could configure the autoscaling or implement a cache mechanism across the different services of the applications.
Improve the Resiliency
To contain this latency propagation, you are going to apply the Retry pattern to all services calling the delayed 'discounts' services.
Retries can improve the application resiliency against transcient problems such as a temporarily overloaded service or network like we simulate in our experiment.
Instead of failing directly or waiting too long, we could retry N number of times to get the desired output with the desired response time before considering as failed.
Configure the Retry pattern for the following services
In the Kiali Console, from the 'Services' view, click on the 'cars' service > 'Actions' > 'Request Timeouts'
Add HTTP Retry by entering the following settings:
| Parameter | Value | Description |
|---|---|---|
Add HTTP Retry |
Enabled |
|
Attempts |
5 |
|
Per Try Timeout |
20ms |
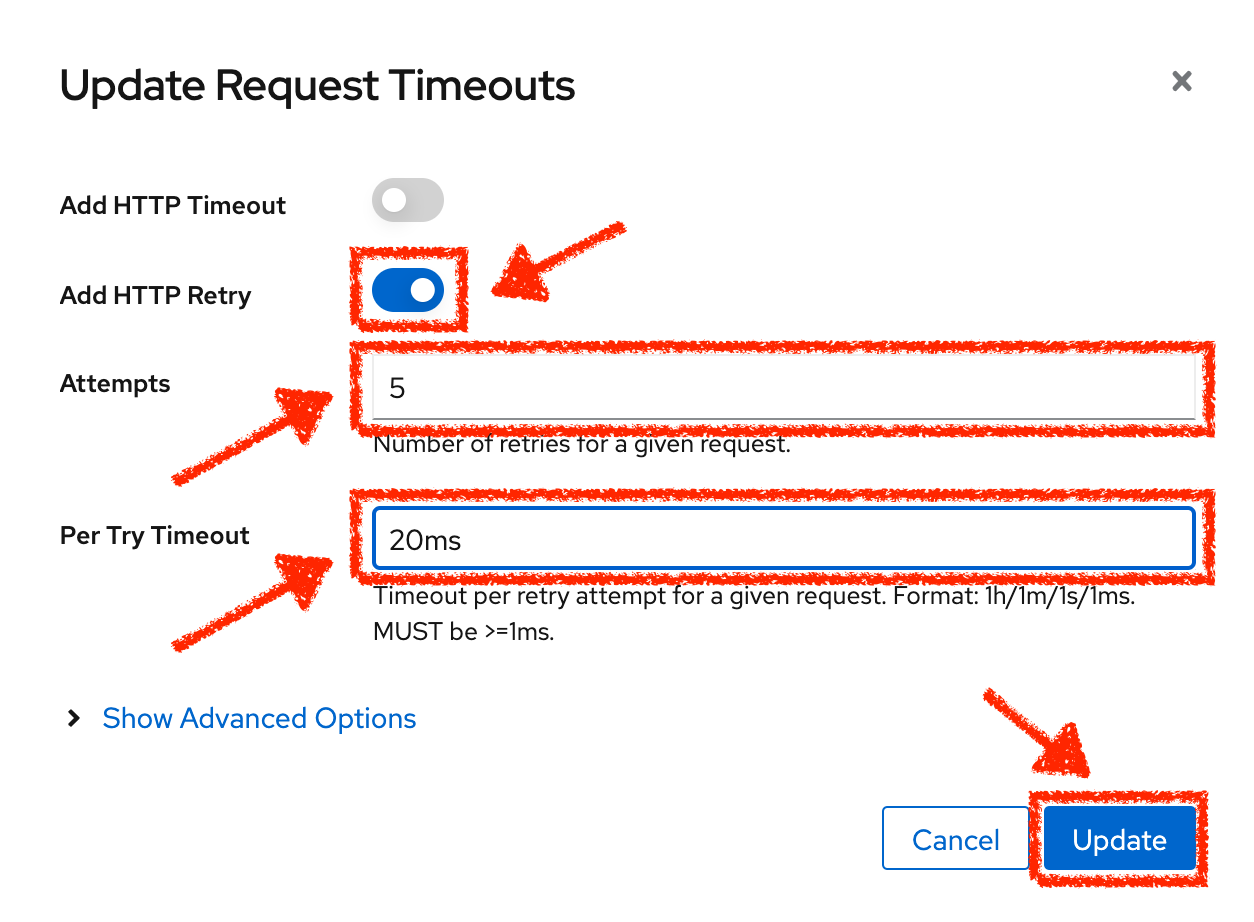
Click on the 'Update' button.
In the Kiali Console, from the 'Services' view, click on the 'flights' service > 'Actions' > 'Request Timeouts'
Add HTTP Retry by entering the following settings:
| Parameter | Value | Description |
|---|---|---|
Add HTTP Retry |
Enabled |
|
Attempts |
5 |
|
Per Try Timeout |
20ms |

Click on the 'Update' button.
In the Kiali Console, from the 'Services' view, click on the 'hotels' service > 'Actions' > 'Request Timeouts'
Add HTTP Retry by entering the following settings:
| Parameter | Value | Description |
|---|---|---|
Add HTTP Retry |
Enabled |
|
Attempts |
5 |
|
Per Try Timeout |
20ms |

Click on the 'Update' button.
In the Kiali Console, from the 'Services' view, click on the 'insurances' service > 'Actions' > 'Request Timeouts'
Add HTTP Retry by entering the following settings:
| Parameter | Value | Description |
|---|---|---|
Add HTTP Retry |
Enabled |
|
Attempts |
5 |
|
Per Try Timeout |
20ms |

Click on the 'Update' button.
Validate the Improvement
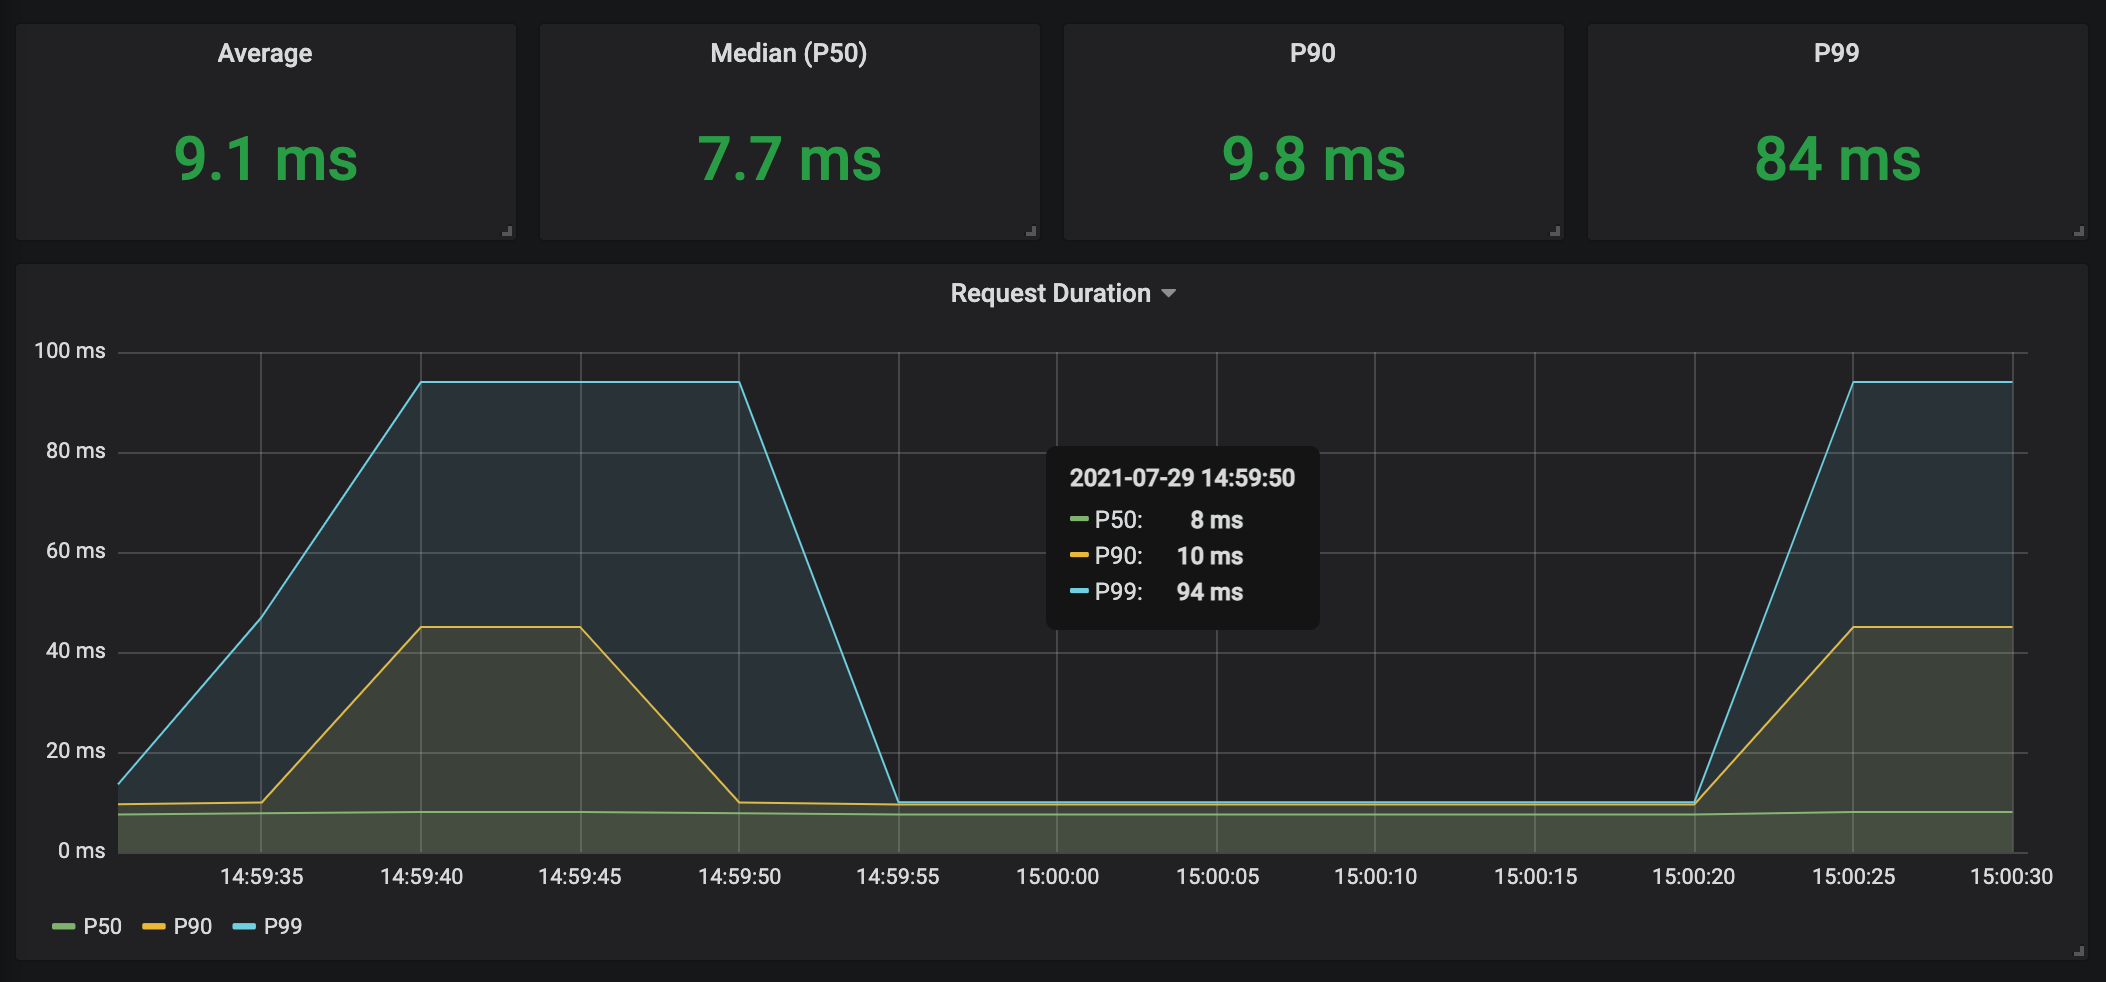
Back into the Chaos Engineering Dashboard, you can tell that we manage to contain the latency propagation by not exceeding 100 ms in general using the Retry pattern while the 'discounts' service still has the 1s latency issue.

You can see more detail on the 'Request Duration' panel for the 'travels' service
Rollback the Chaos experiment
There is nothing more simple than rollbacking all configurations you have done during this lab with Argo CD.
In Argo CD, click on 'Sync > Synchronize'.
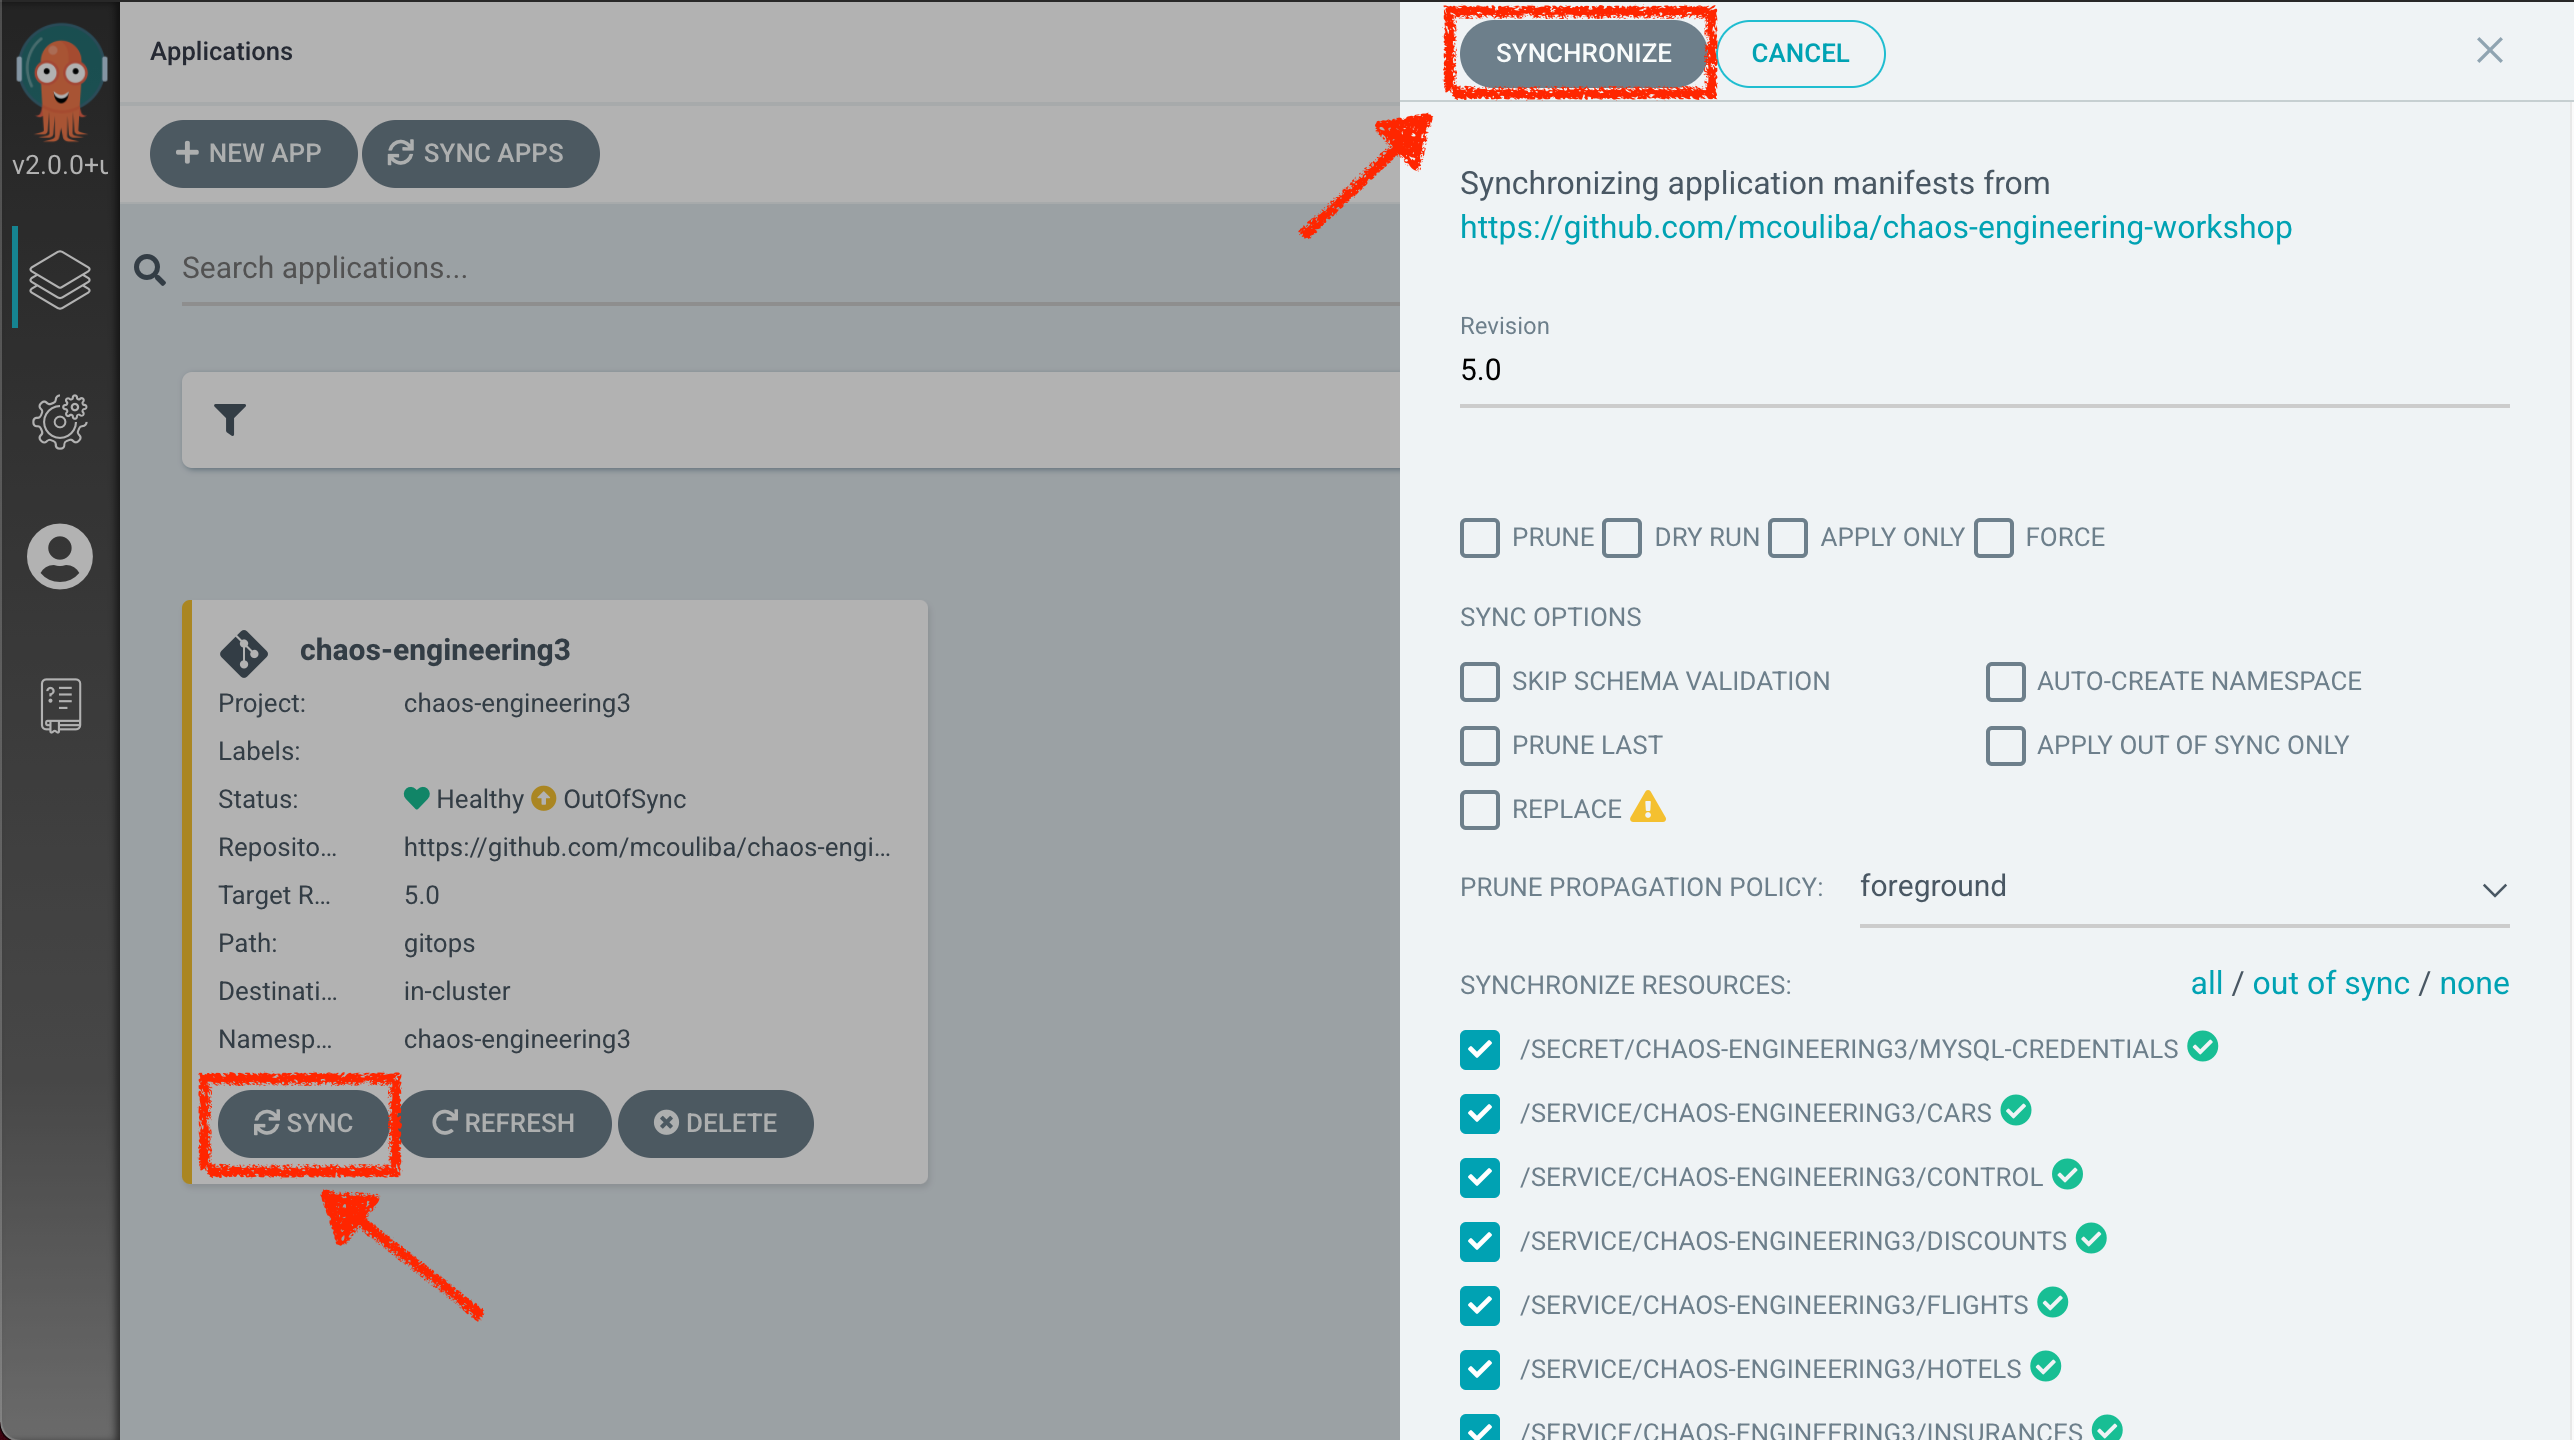
Finally, in the Chaos Engineering Dashboard, please check the application is back in the steady state.
