Explore the Application
10 MINUTE PRACTICE
Observability with Kiali
Kiali provides an interactive graph view of your namespace in real time, being able to display the interactions at several levels (applications, versions, workloads), with contextual information and charts on the selected graph node or edge.
Click on the 'Kiali' button below
Then, log in with OpenShift as user%USER_ID%/%OPENSHIFT_PASSWORD%'
Select the 'Graph' view, from the side menu bar and enter the following configuration:
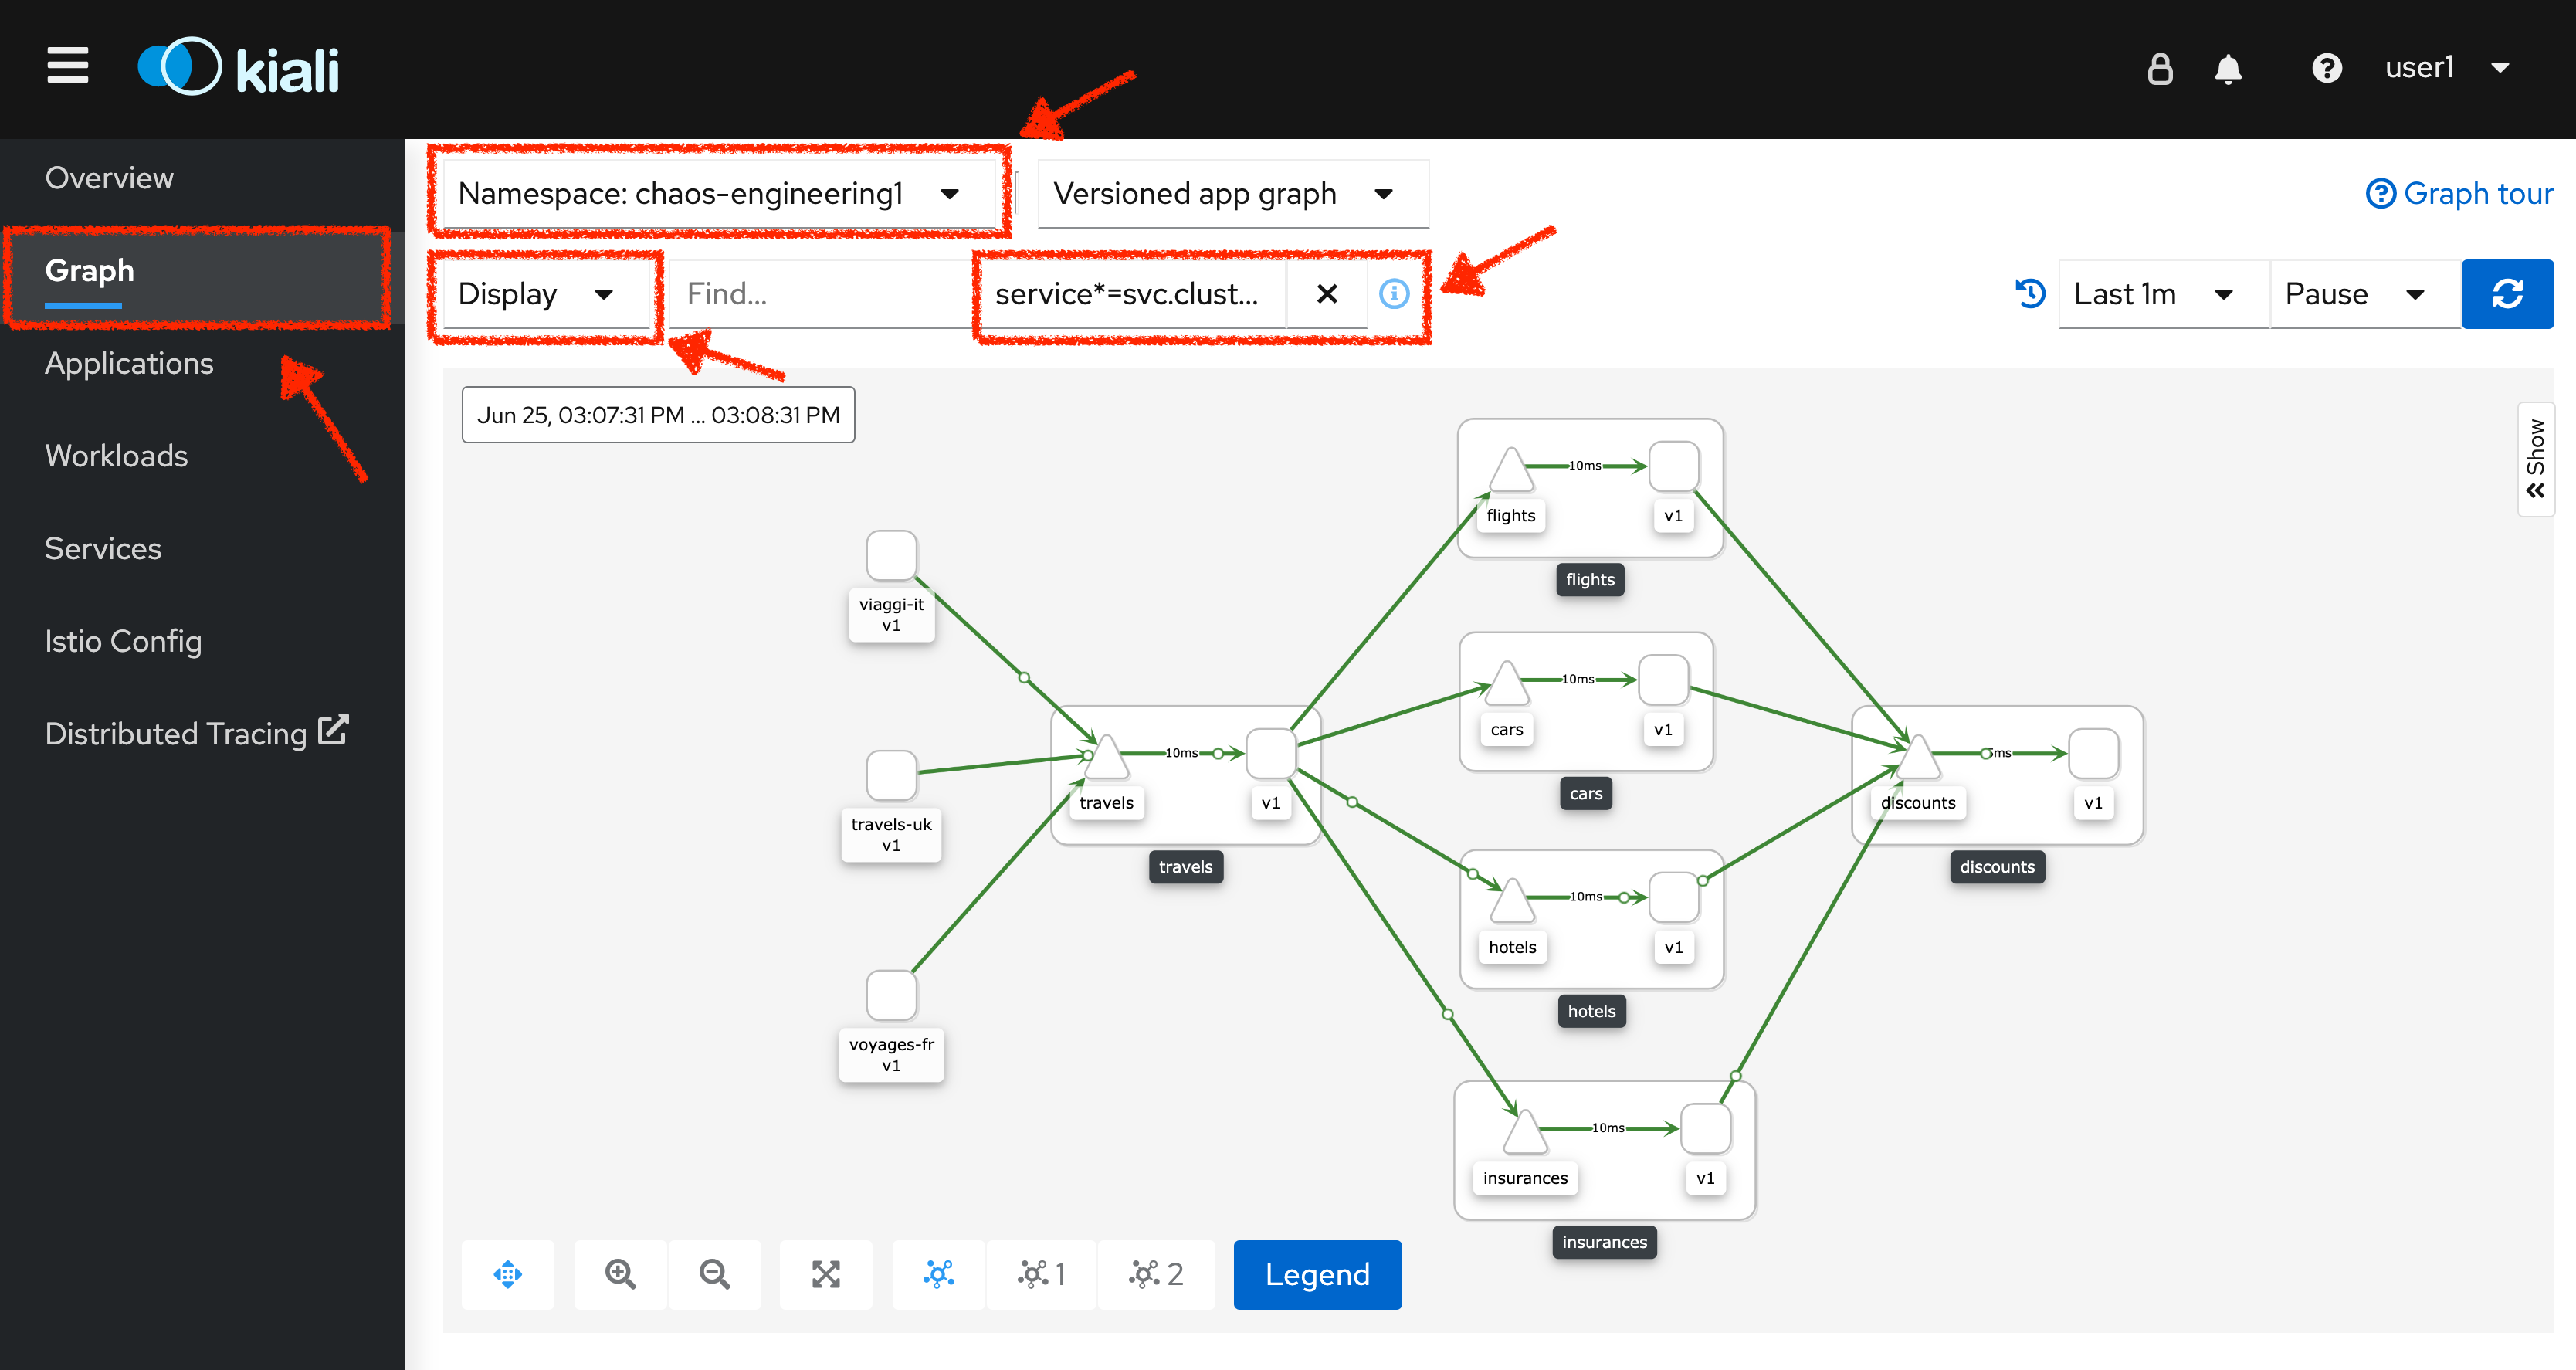
The outcome is a graph with all the services, connected by the requests going through them. You can see how the services interact with each other.
| Parameter | Value |
|---|---|
Namespace |
chaos-engineering%USER_ID% |
Type Graph |
Versioned app graph |
Display |
'Response Time' checked 'Traffic Animation' checked |
Hide… |
service*=svc.cluster.local |
Understand the Application
Before continuing we will describe the application used in this workshop.
This demo application deploys several services into 1 namespace.
-
'chaos-engineering%USER_ID%' namespace
Inside the 'chaos-engineering%USER_ID%' namespace we see 3 parts
-
Travel-portal
-
Travel-agency
-
Travel-control
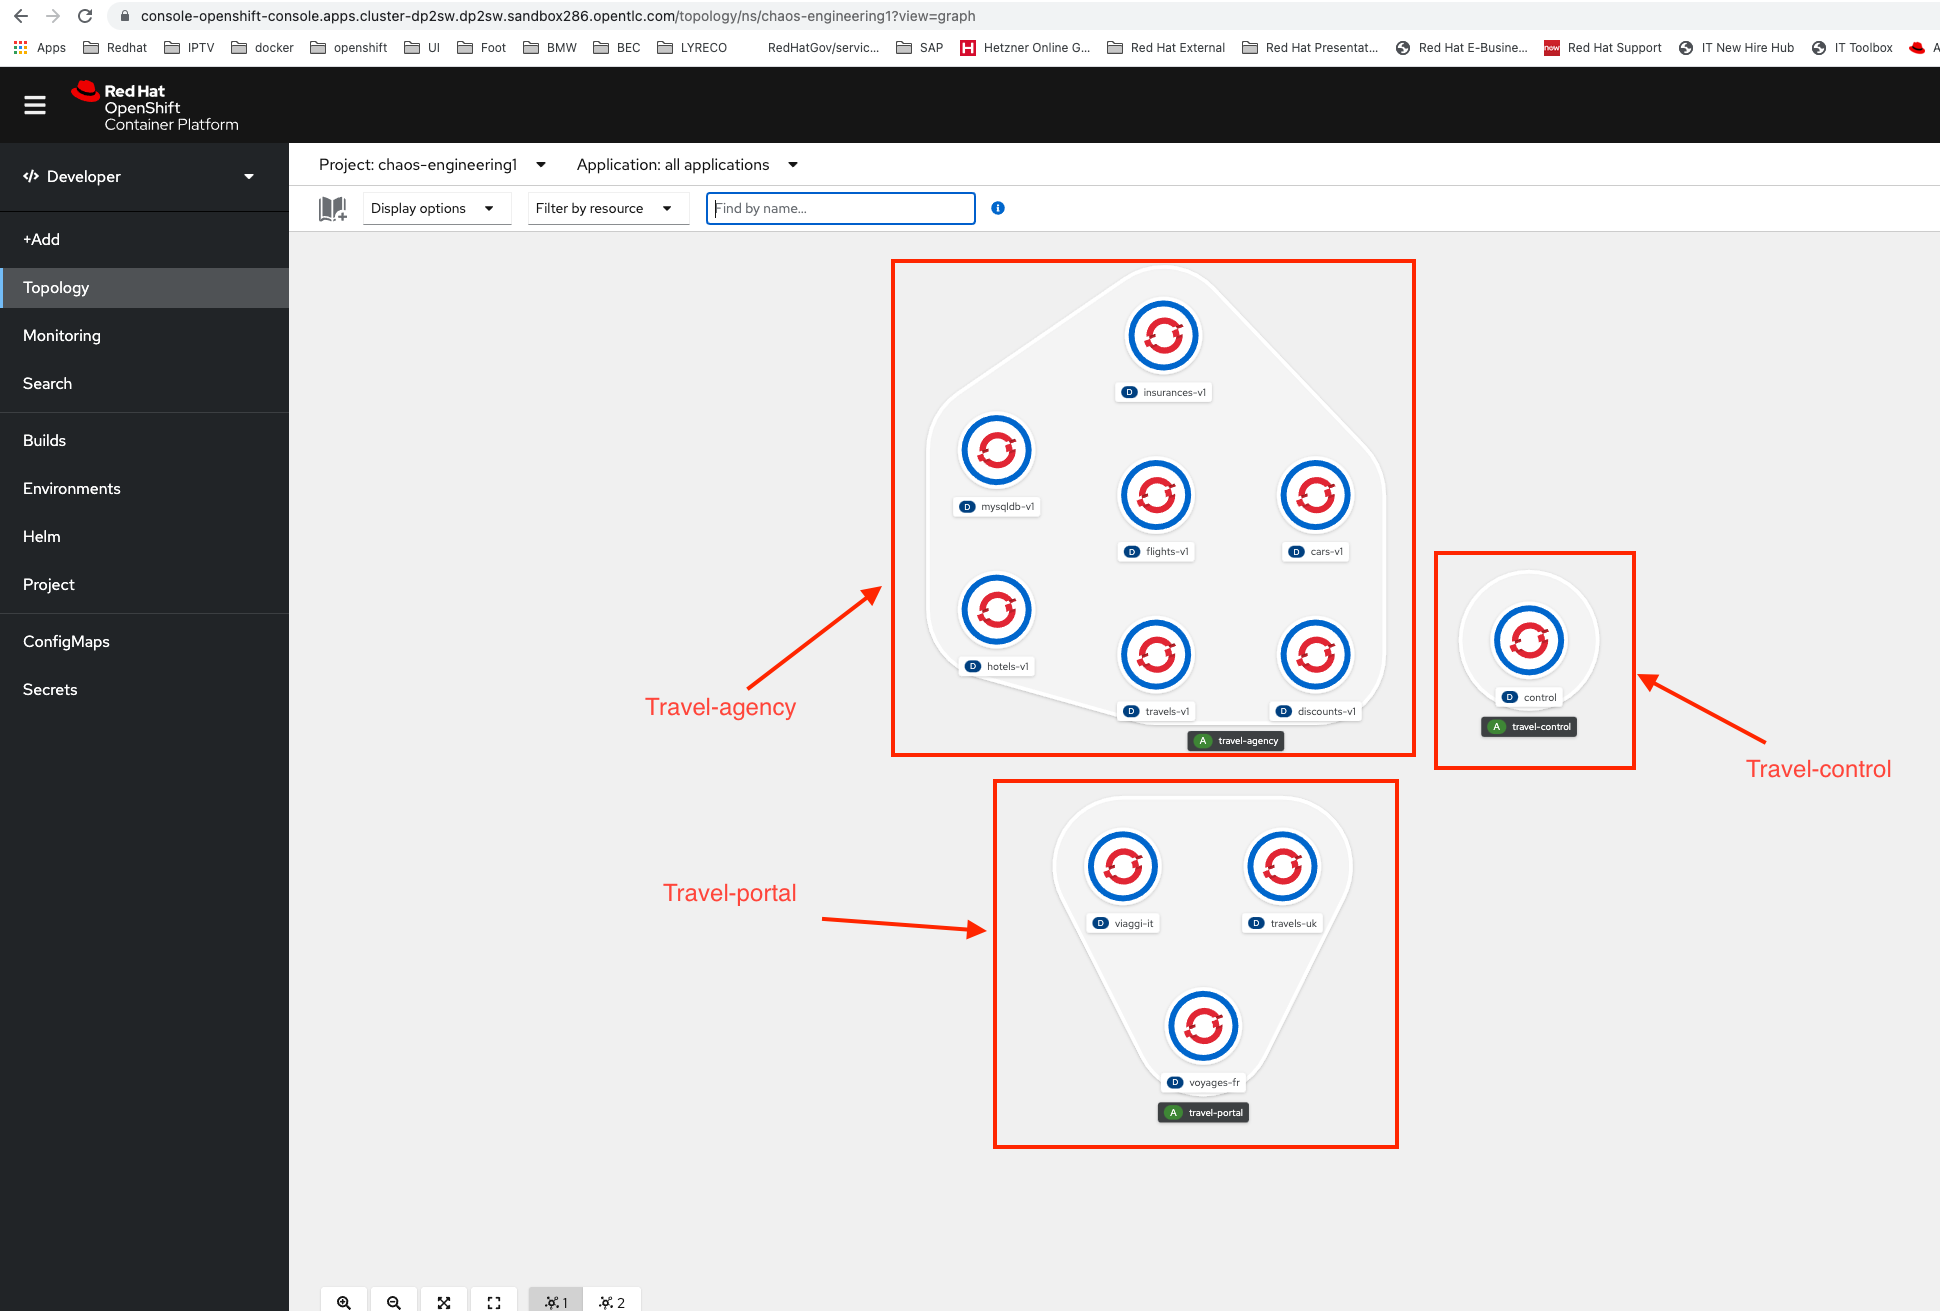
The Travels Demo application simulates two business domains:
Travel Portal
In a first part called travel-portal there will be deployed several travel shops, where users can search for and book flights, hotels, cars or insurance.
The shop applications can behave differently based on request characteristics like channel (web or mobile) or user (new or existing).
These workloads may generate different types of traffic to imitate different real scenarios.
All the portals consume a service called travels.
Travel Agency
A second part called travel-agency will host a set of services created to provide quotes for travel.
A main travels service will be the business entry point for the travel agency. It receives a destination city and a user as parameters and it calculates all elements that compose a travel budget: airfare, lodging, car reservation and travel insurance.
Each service can provide an independent quote and the travels service must then aggregate them into a single response.
Additionally, some users, like registered users, can have access to special discounts, managed as well by an external service.
Service relations between services of the applications can be described in the following diagram:
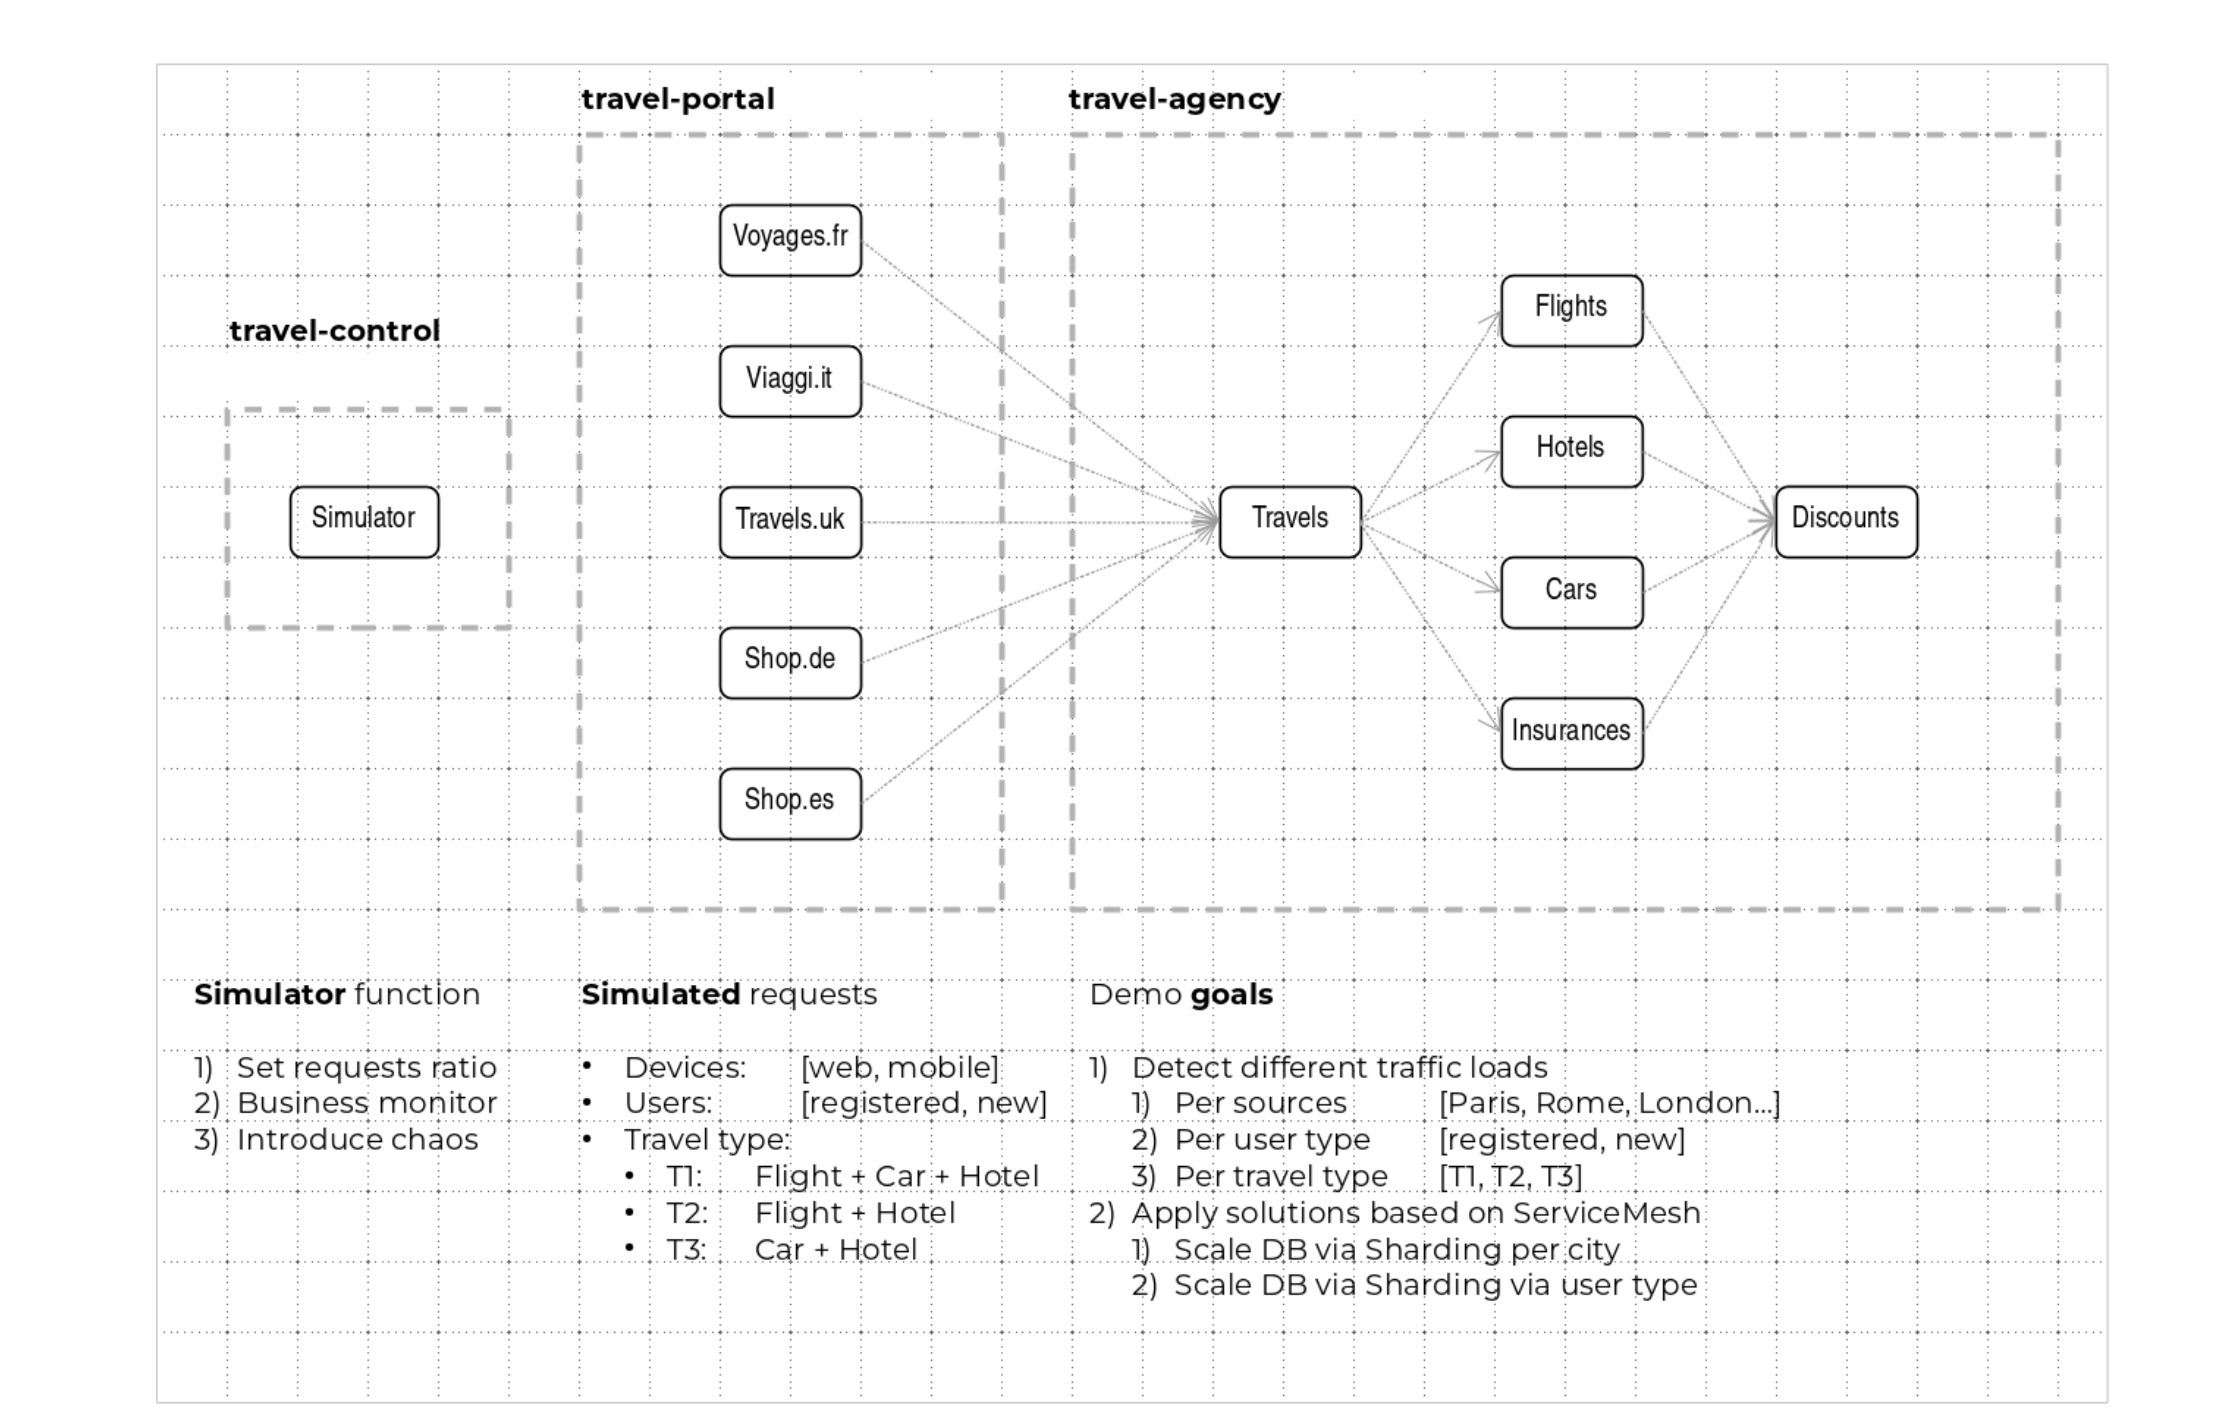
Travel Portal and Travel Agency flow
A typical flow consists of the following steps:
-
A portal queries the travels service for available destinations.
-
Travels service queries the available hotels and returns to the portal shop.
-
A user selects a destination and a type of travel, which may include a flight and/or a car, hotel and insurance.
-
Cars, Hotels and Flights may have available discounts depending on user type.
Travel Control
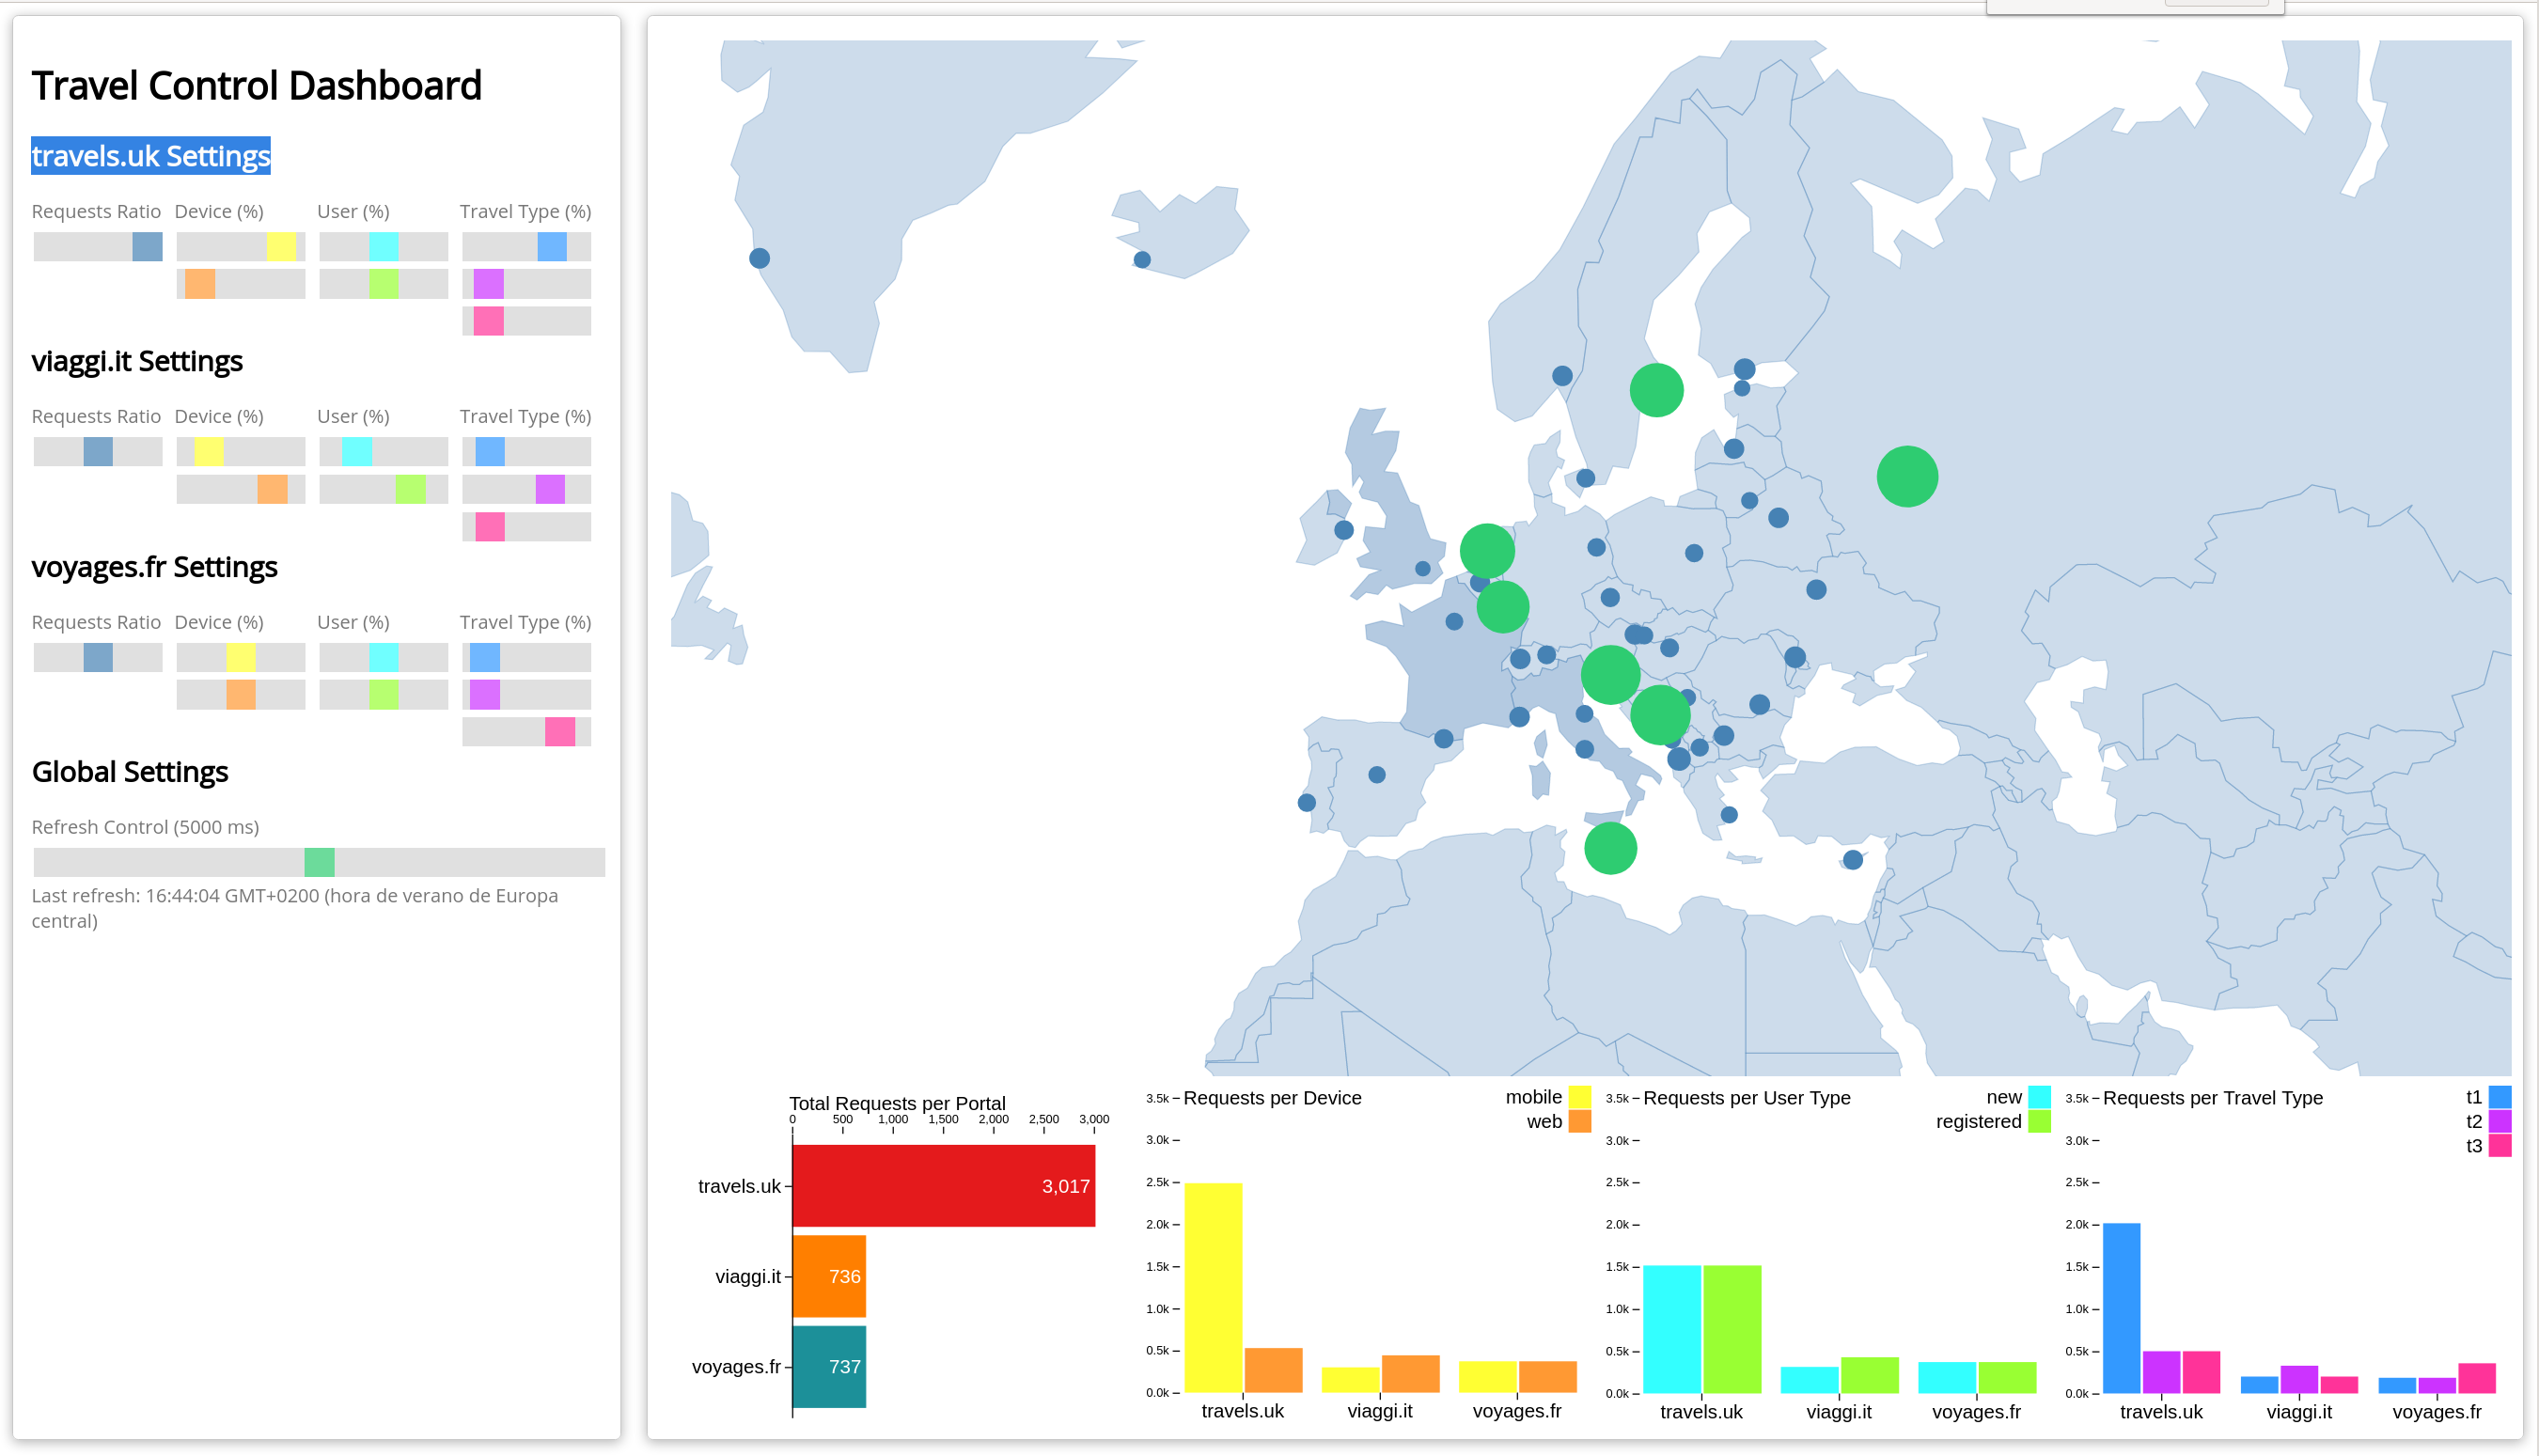
The travel-control runs a business dashboard with two key features:
-
Allow setting changes for every travel shop simulator (traffic ratio, device, user and type of travel).
-
Provide a business view of the total requests generated from the travel-control service to the travel-agency services, organized by business criteria as grouped per shop, per type of traffic and per city.
Access the Application
To access to the dashboard (UI) of the application, we will need to create a specific Istio Ingress component.
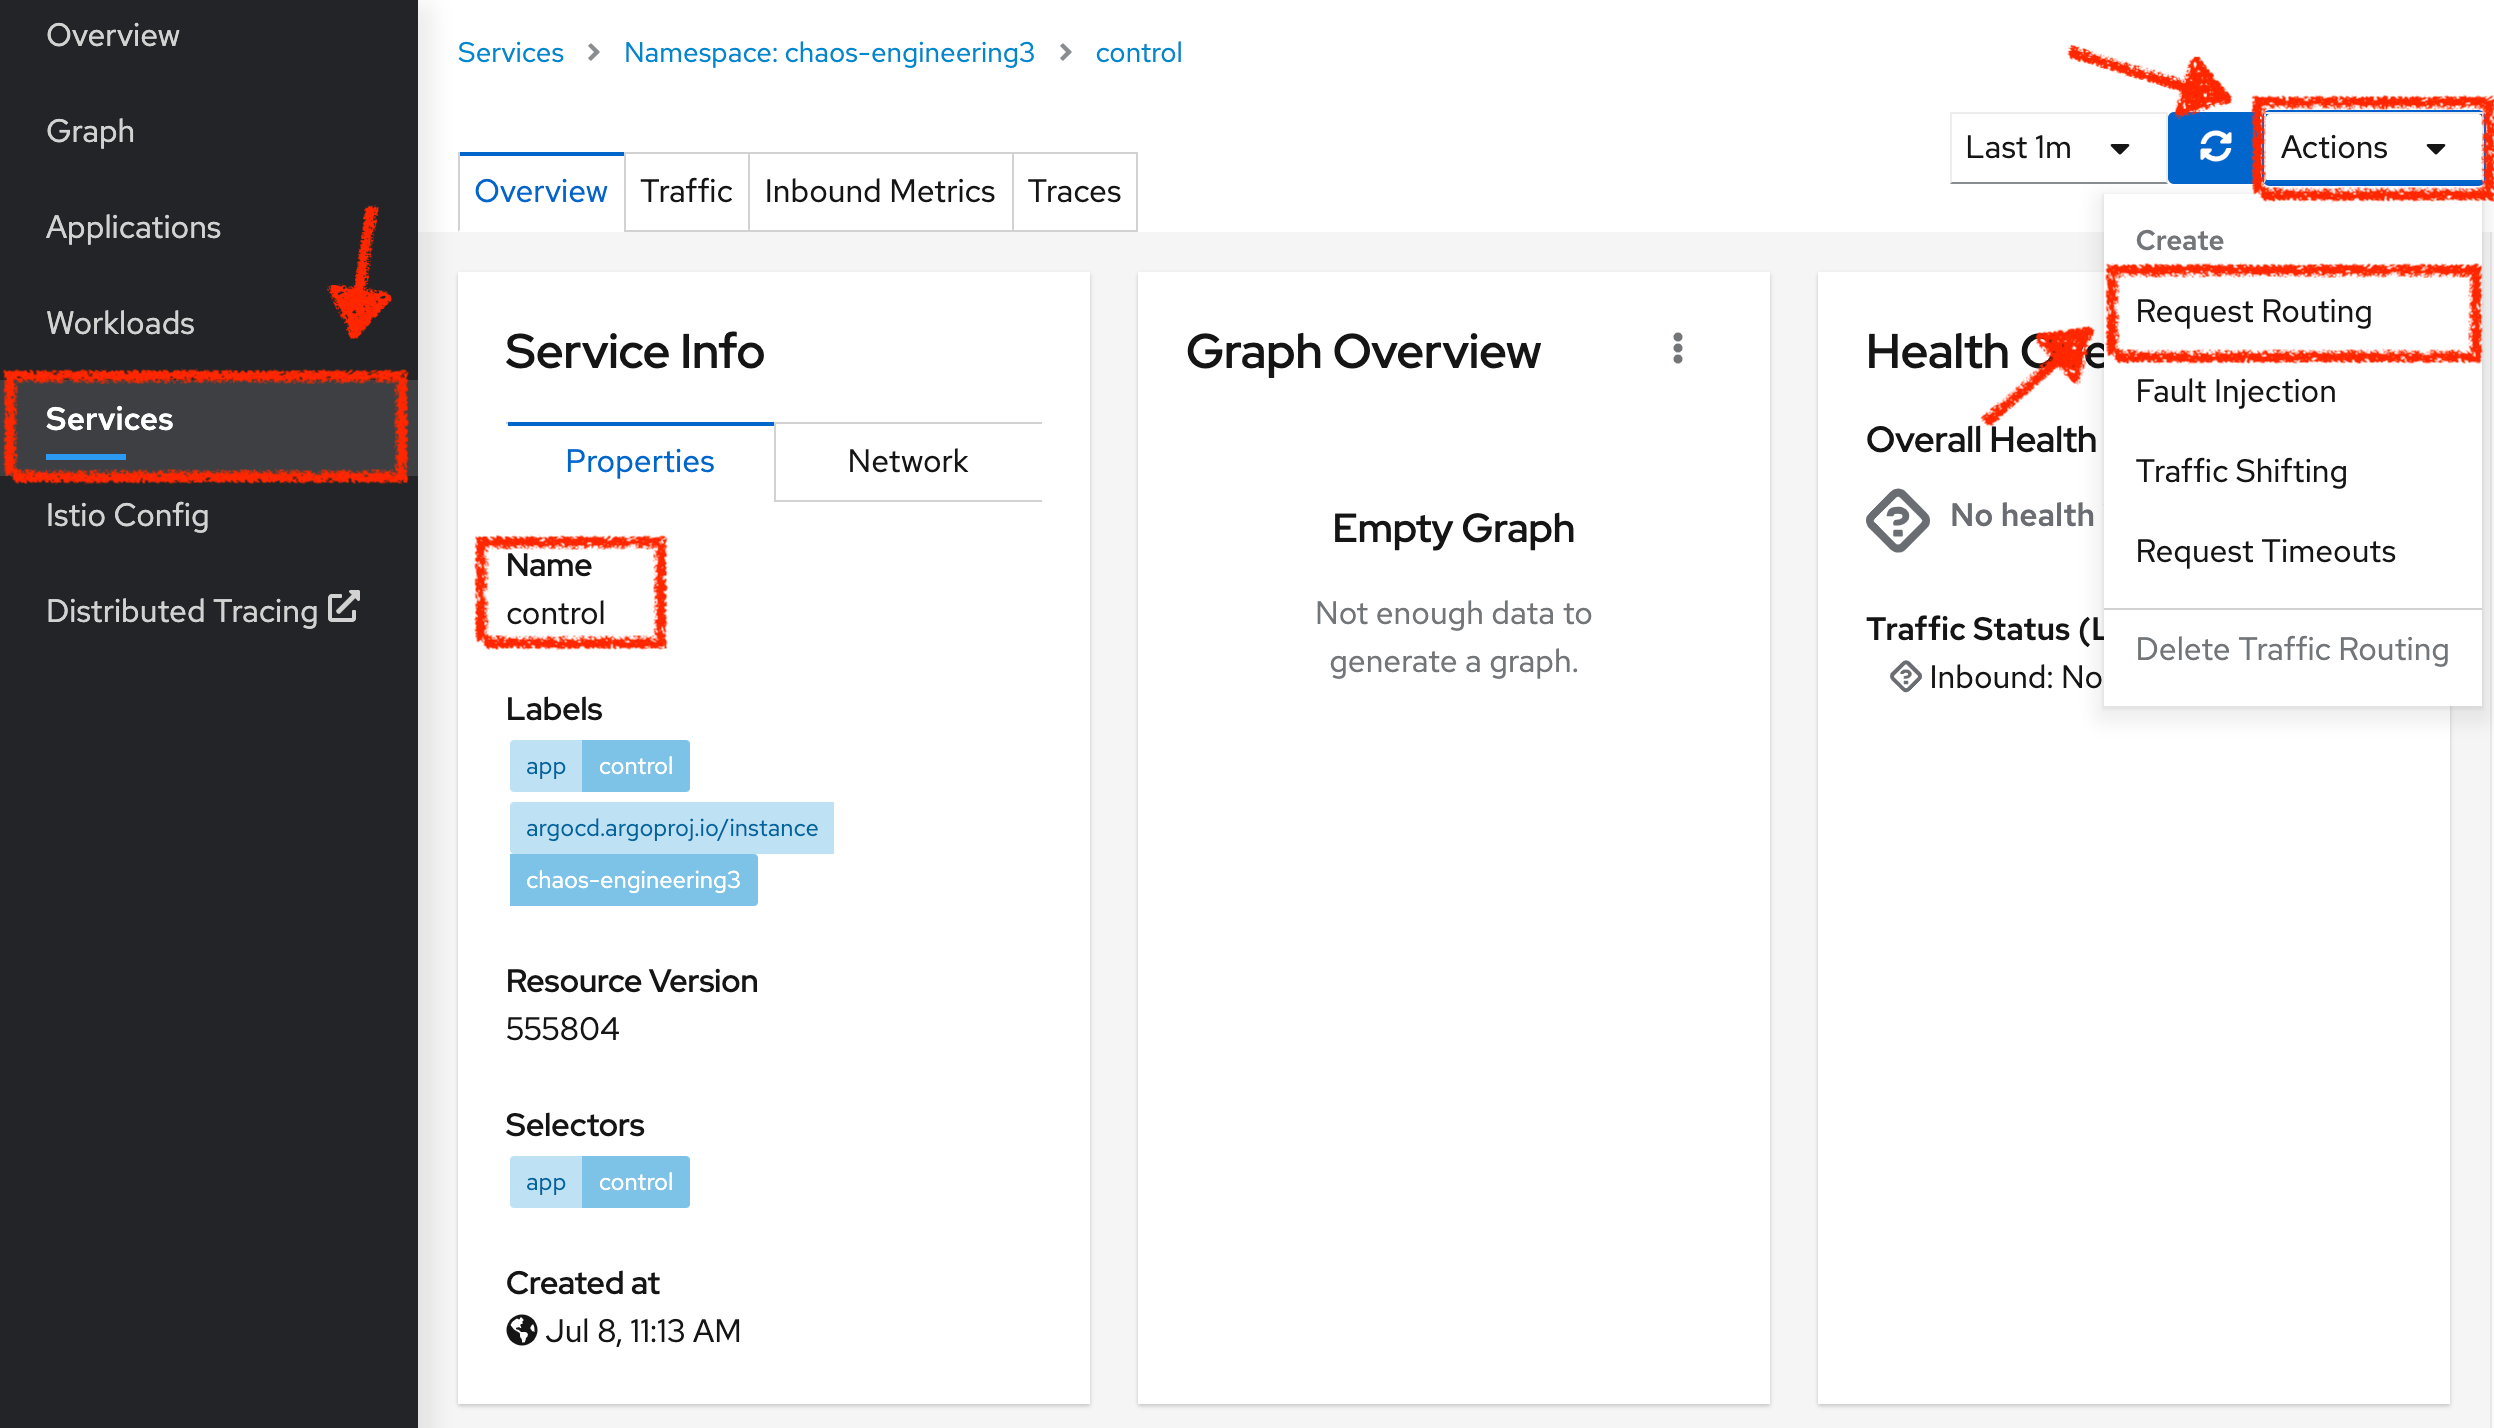
In the Kiali Console, from the 'Services' view, click on the 'control' service > 'Actions' > 'Request Routing'
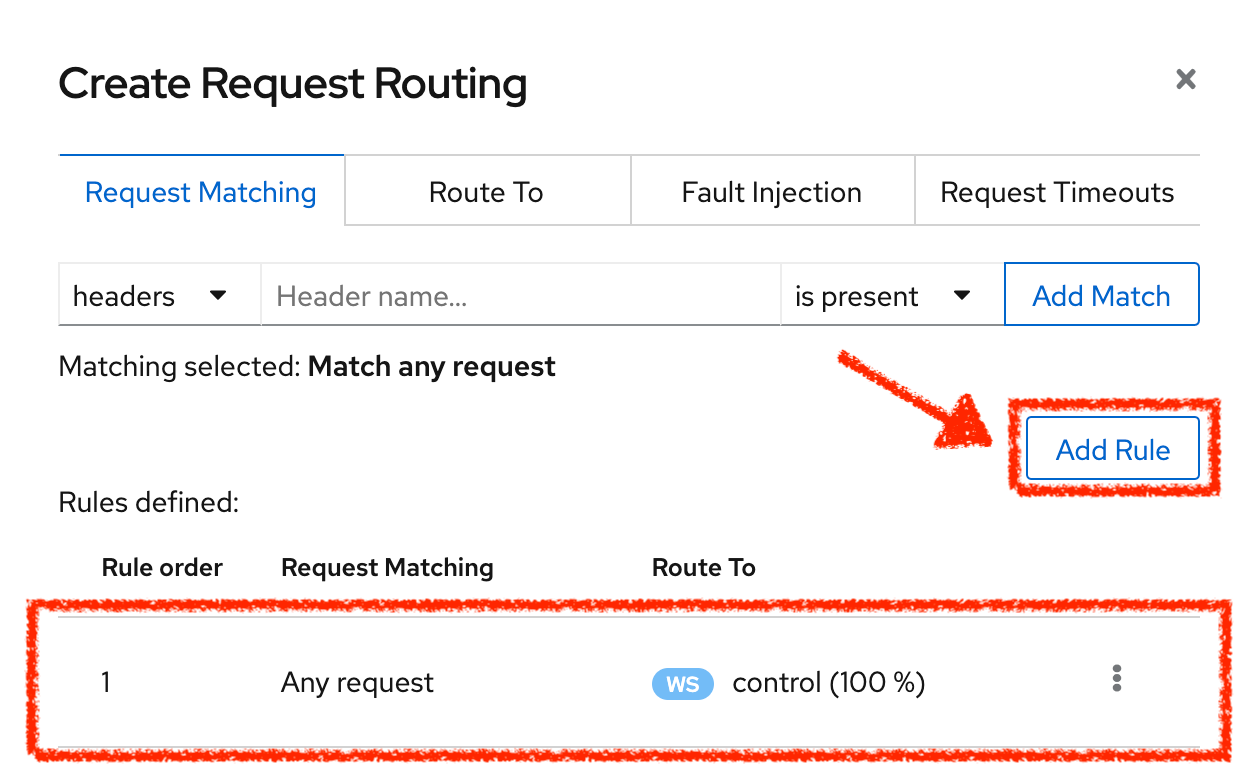
Click on 'Add Rule' button to redirect all the ingress traffic to the 'control' service*`:
Then click on 'Show Advanced Options' and entering the following information:
| Parameter | Value | Description |
|---|---|---|
Add Gateway |
Enabled |
|
Gateway Hosts |
control-chaos-engineering%USER_ID%.%APPS_HOSTNAME_SUFFIX% |
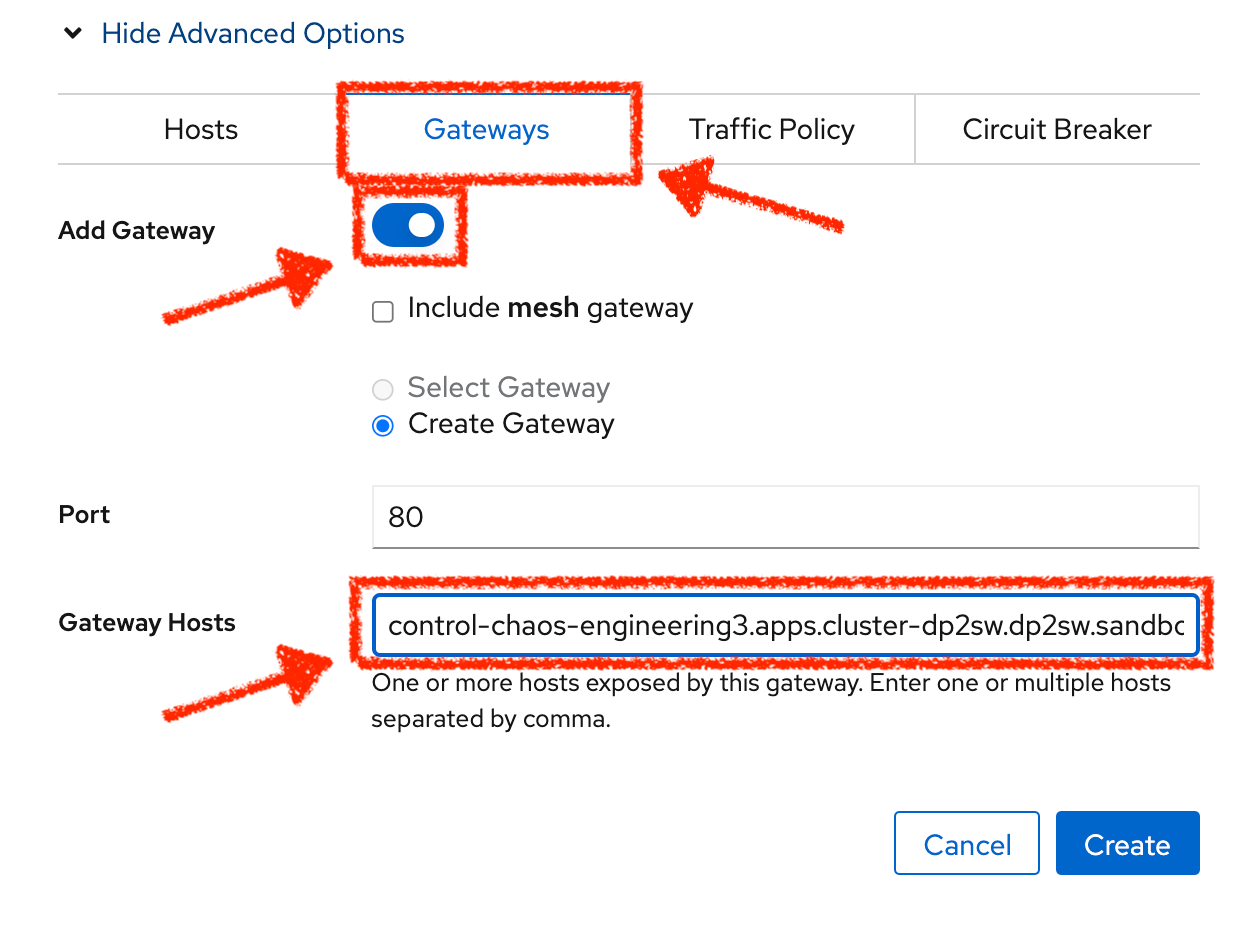
Finally, click on the 'Create' button. You can now access the Travel Control Dashboard using the following URL, http://control-chaos-engineering%USER_ID%.%APPS_HOSTNAME_SUFFIX%.
