"Trace Within a Trace"
20 MINUTE PRACTICE
Let’s perform a "Trace Within a Trace" strategy called Distributed Tracing to infiltrate the application traces and extract valuable information to solve the issues.
What is Jaeger?
Jaeger Tracing, inspired by Dapper and OpenZipkin, is a distributed tracing system released as open source by Uber Technologies. It is used for monitoring and troubleshooting microservices-based distributed systems, including:
-
Distributed context propagation
-
Distributed transaction monitoring
-
Root cause analysis
-
Service dependency analysis
-
Performance / latency optimization
Kiali includes Jaeger Tracing to provide distributed tracing out of the box.
What are you hidding, Mr/Mrs Application?
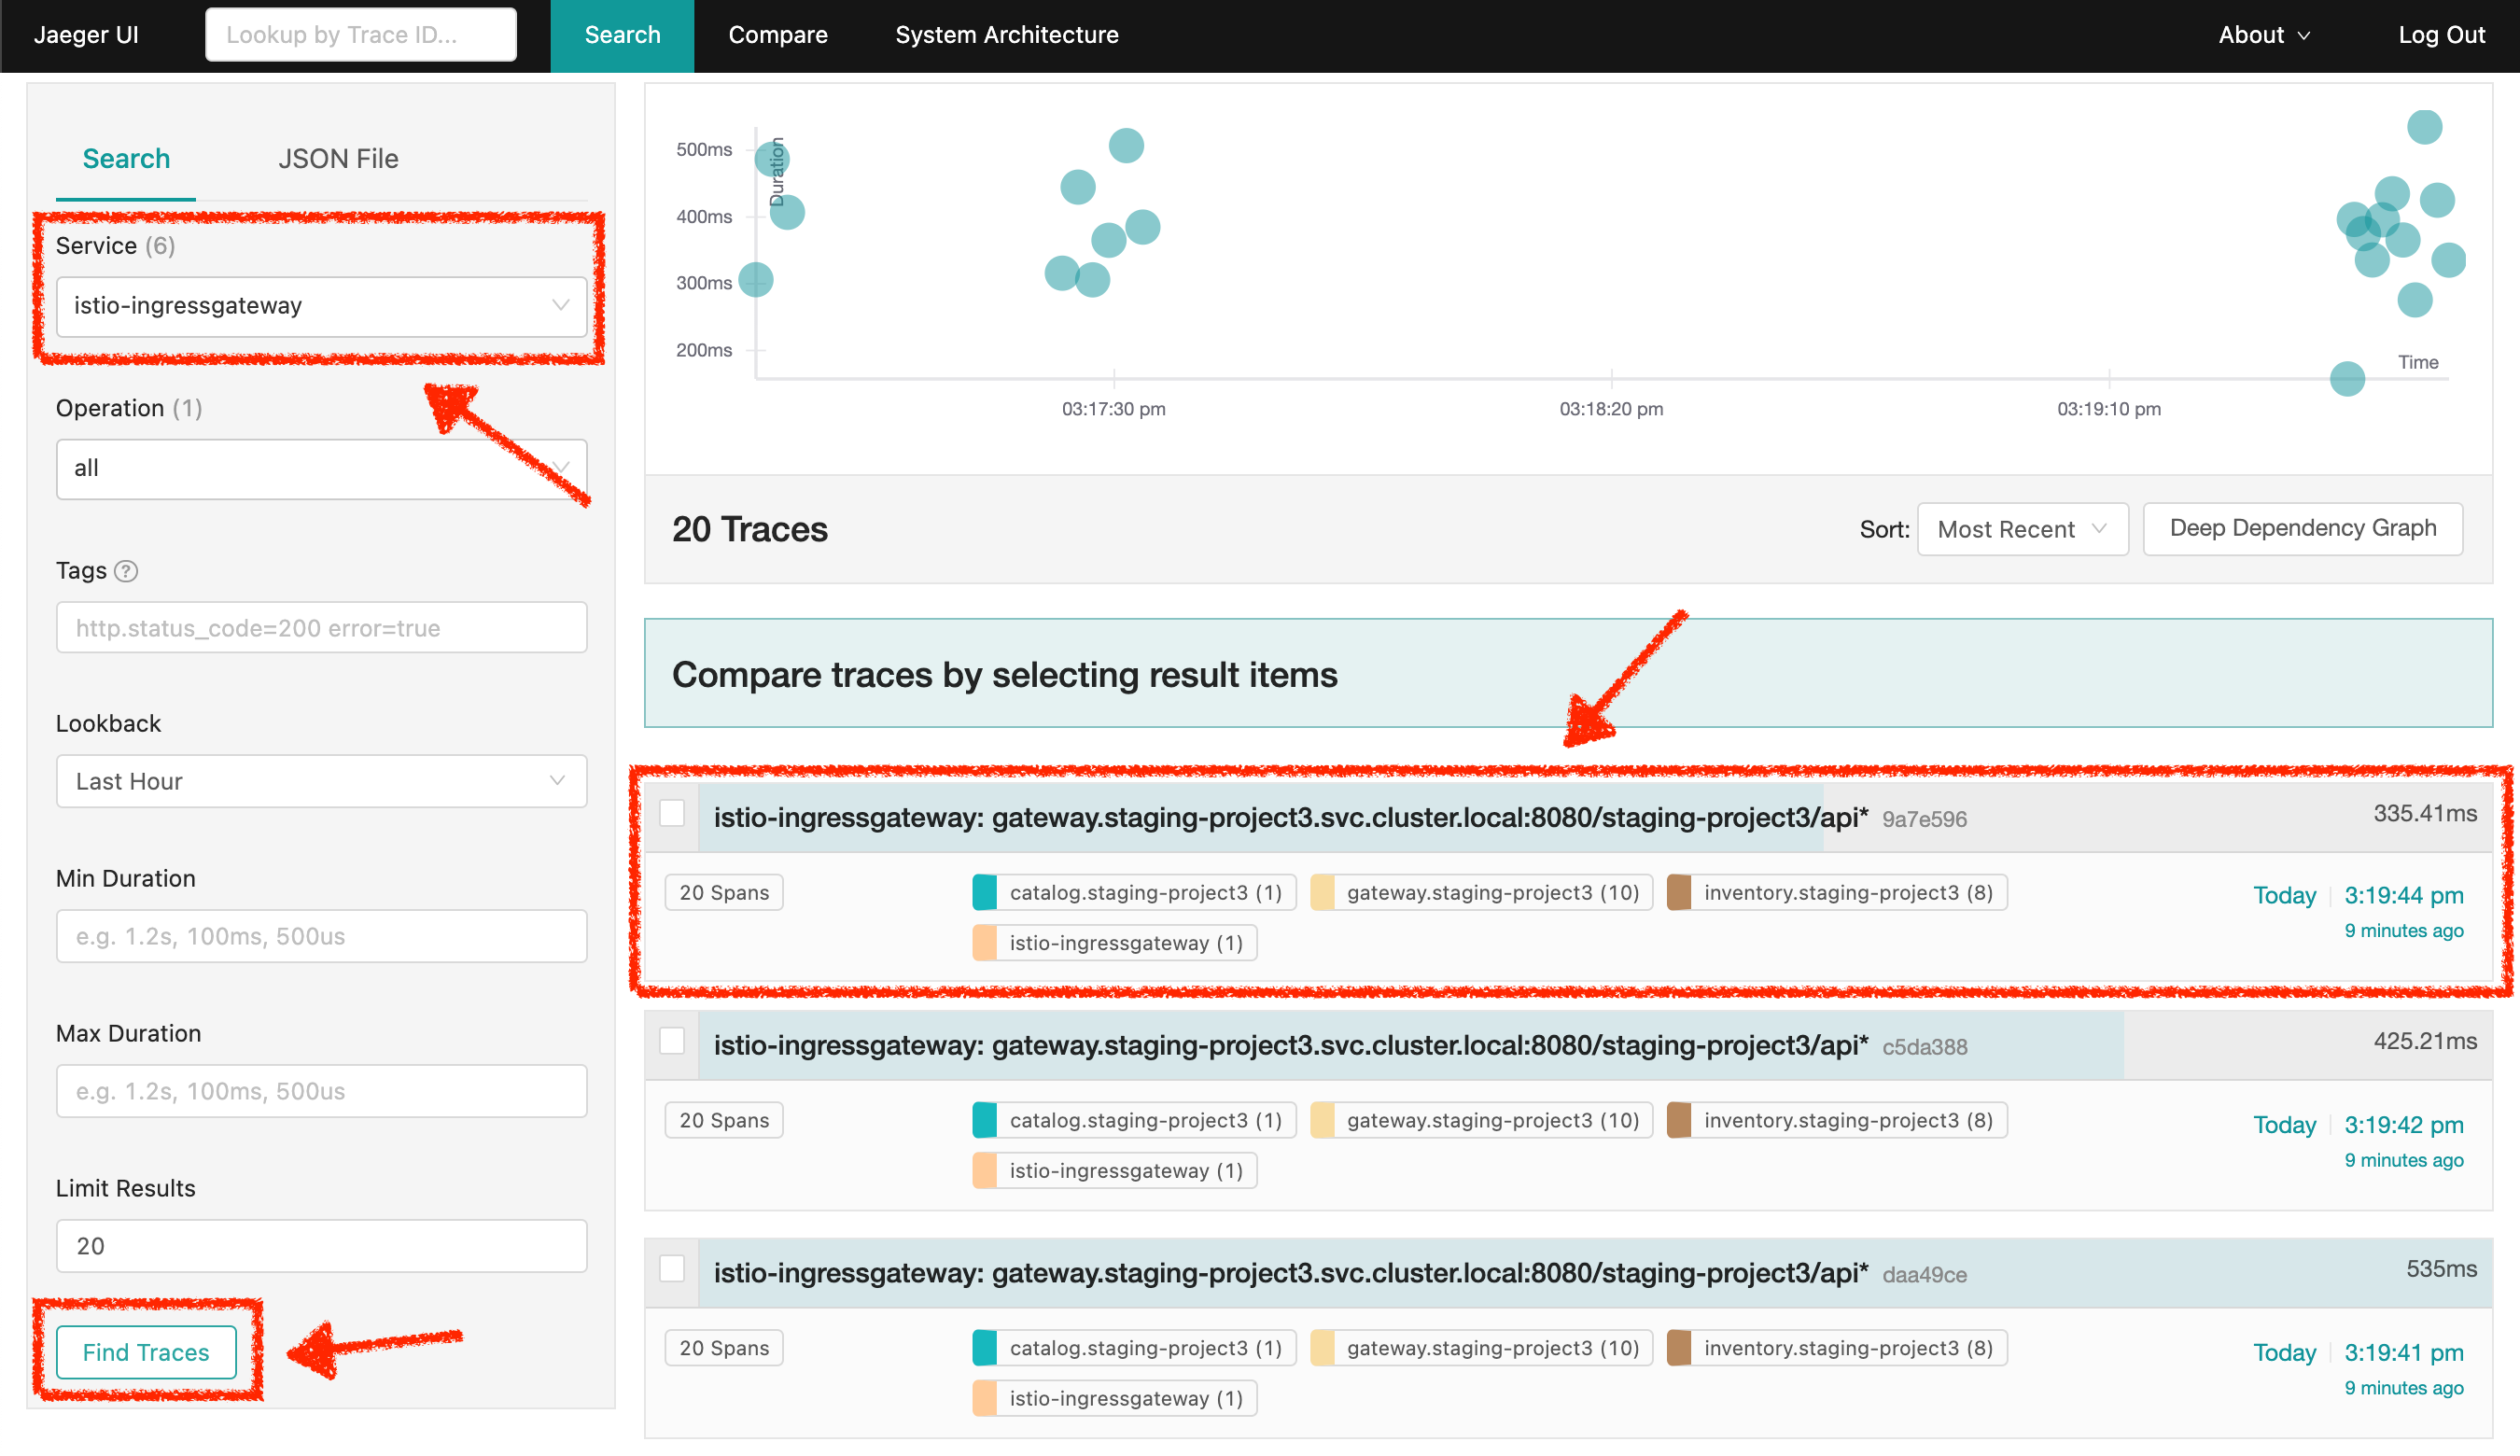
From the Kiali Console, click on the 'Distributed Tracing' in the left navigation.
Then login as user%USER_ID%/%OPENSHIFT_PASSWORD% and enter the following configuration:
| Parameter | Value |
|---|---|
Service |
istio-ingressgateway |
Click on the 'Find Traces' button
Now you can see the distributed traces of our application.
|
Distributed Tracing involves propagating the tracing context from service to service by sending certain incoming HTTP headers downstream to outbound requests. To do this, services need some hints to tie together the entire trace. They need to propagate the appropriate HTTP headers so that when the proxies send span information, the spans can be correlated correctly into a single trace. |
On the right-hand side of a specific trace, take a look at the duration.
The end-to-end requests takes more than 300ms which you could judge as normal but …
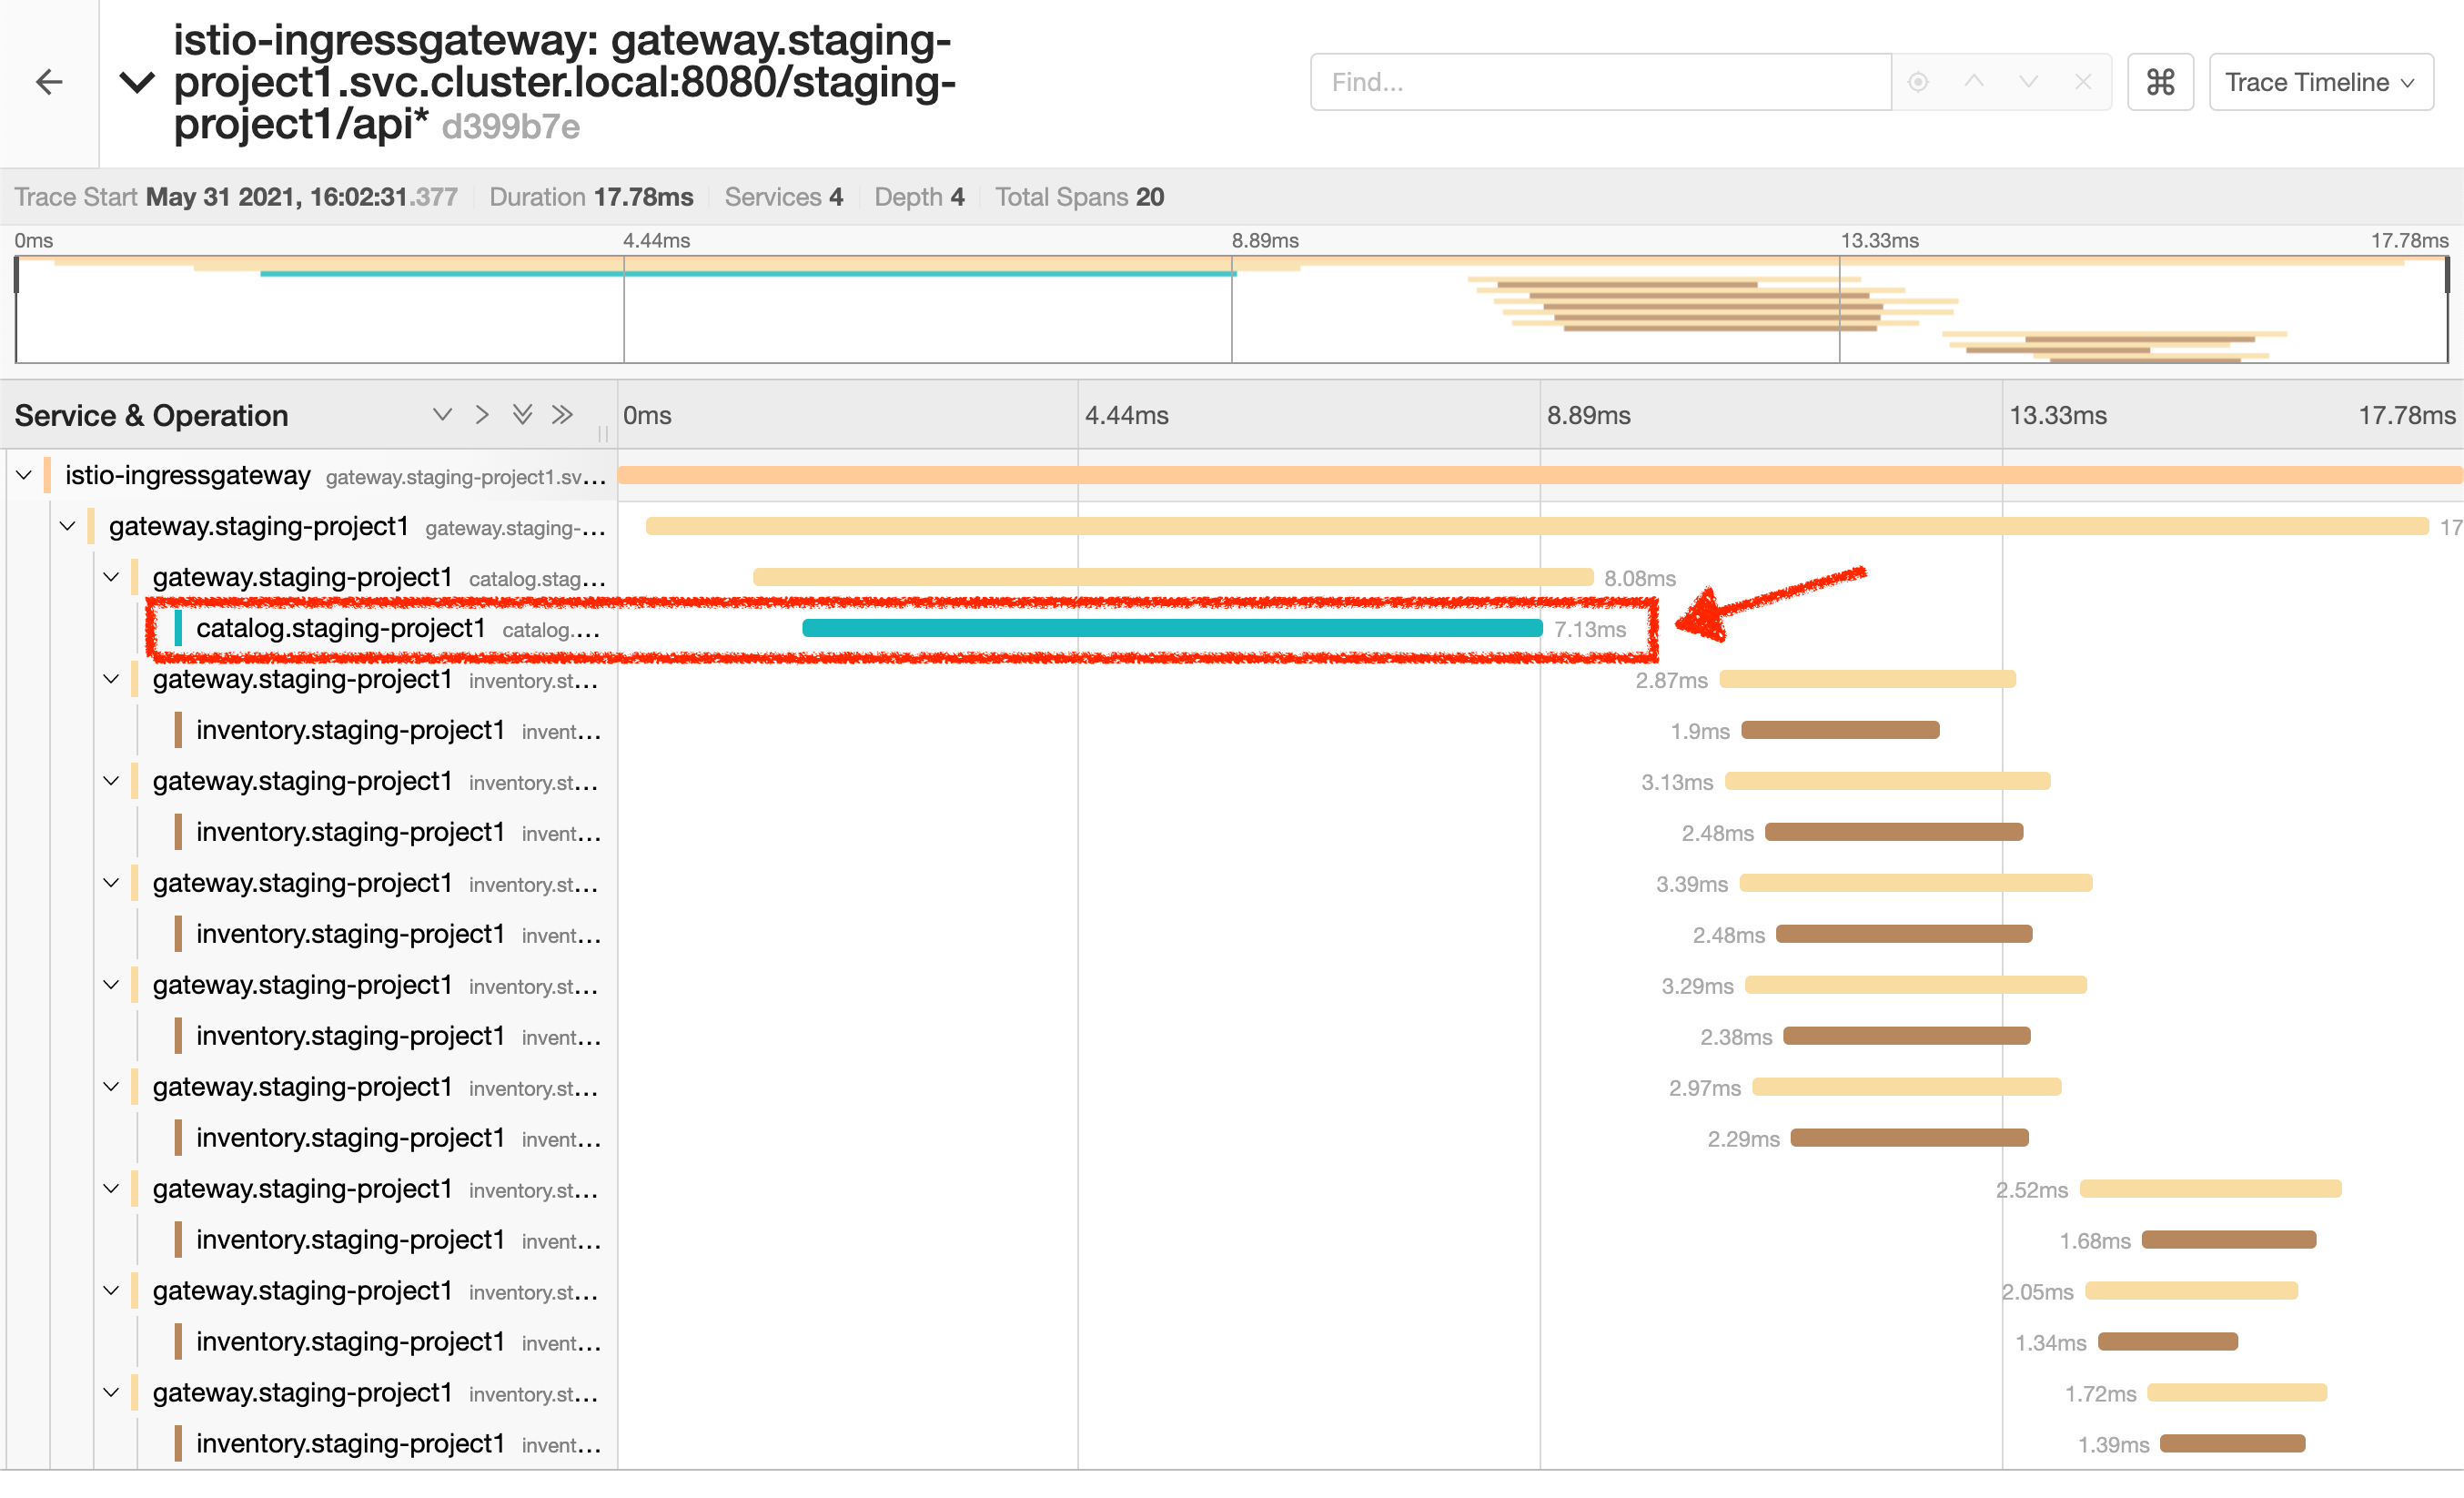
Let’s get more details by clicking a trace on title bar.
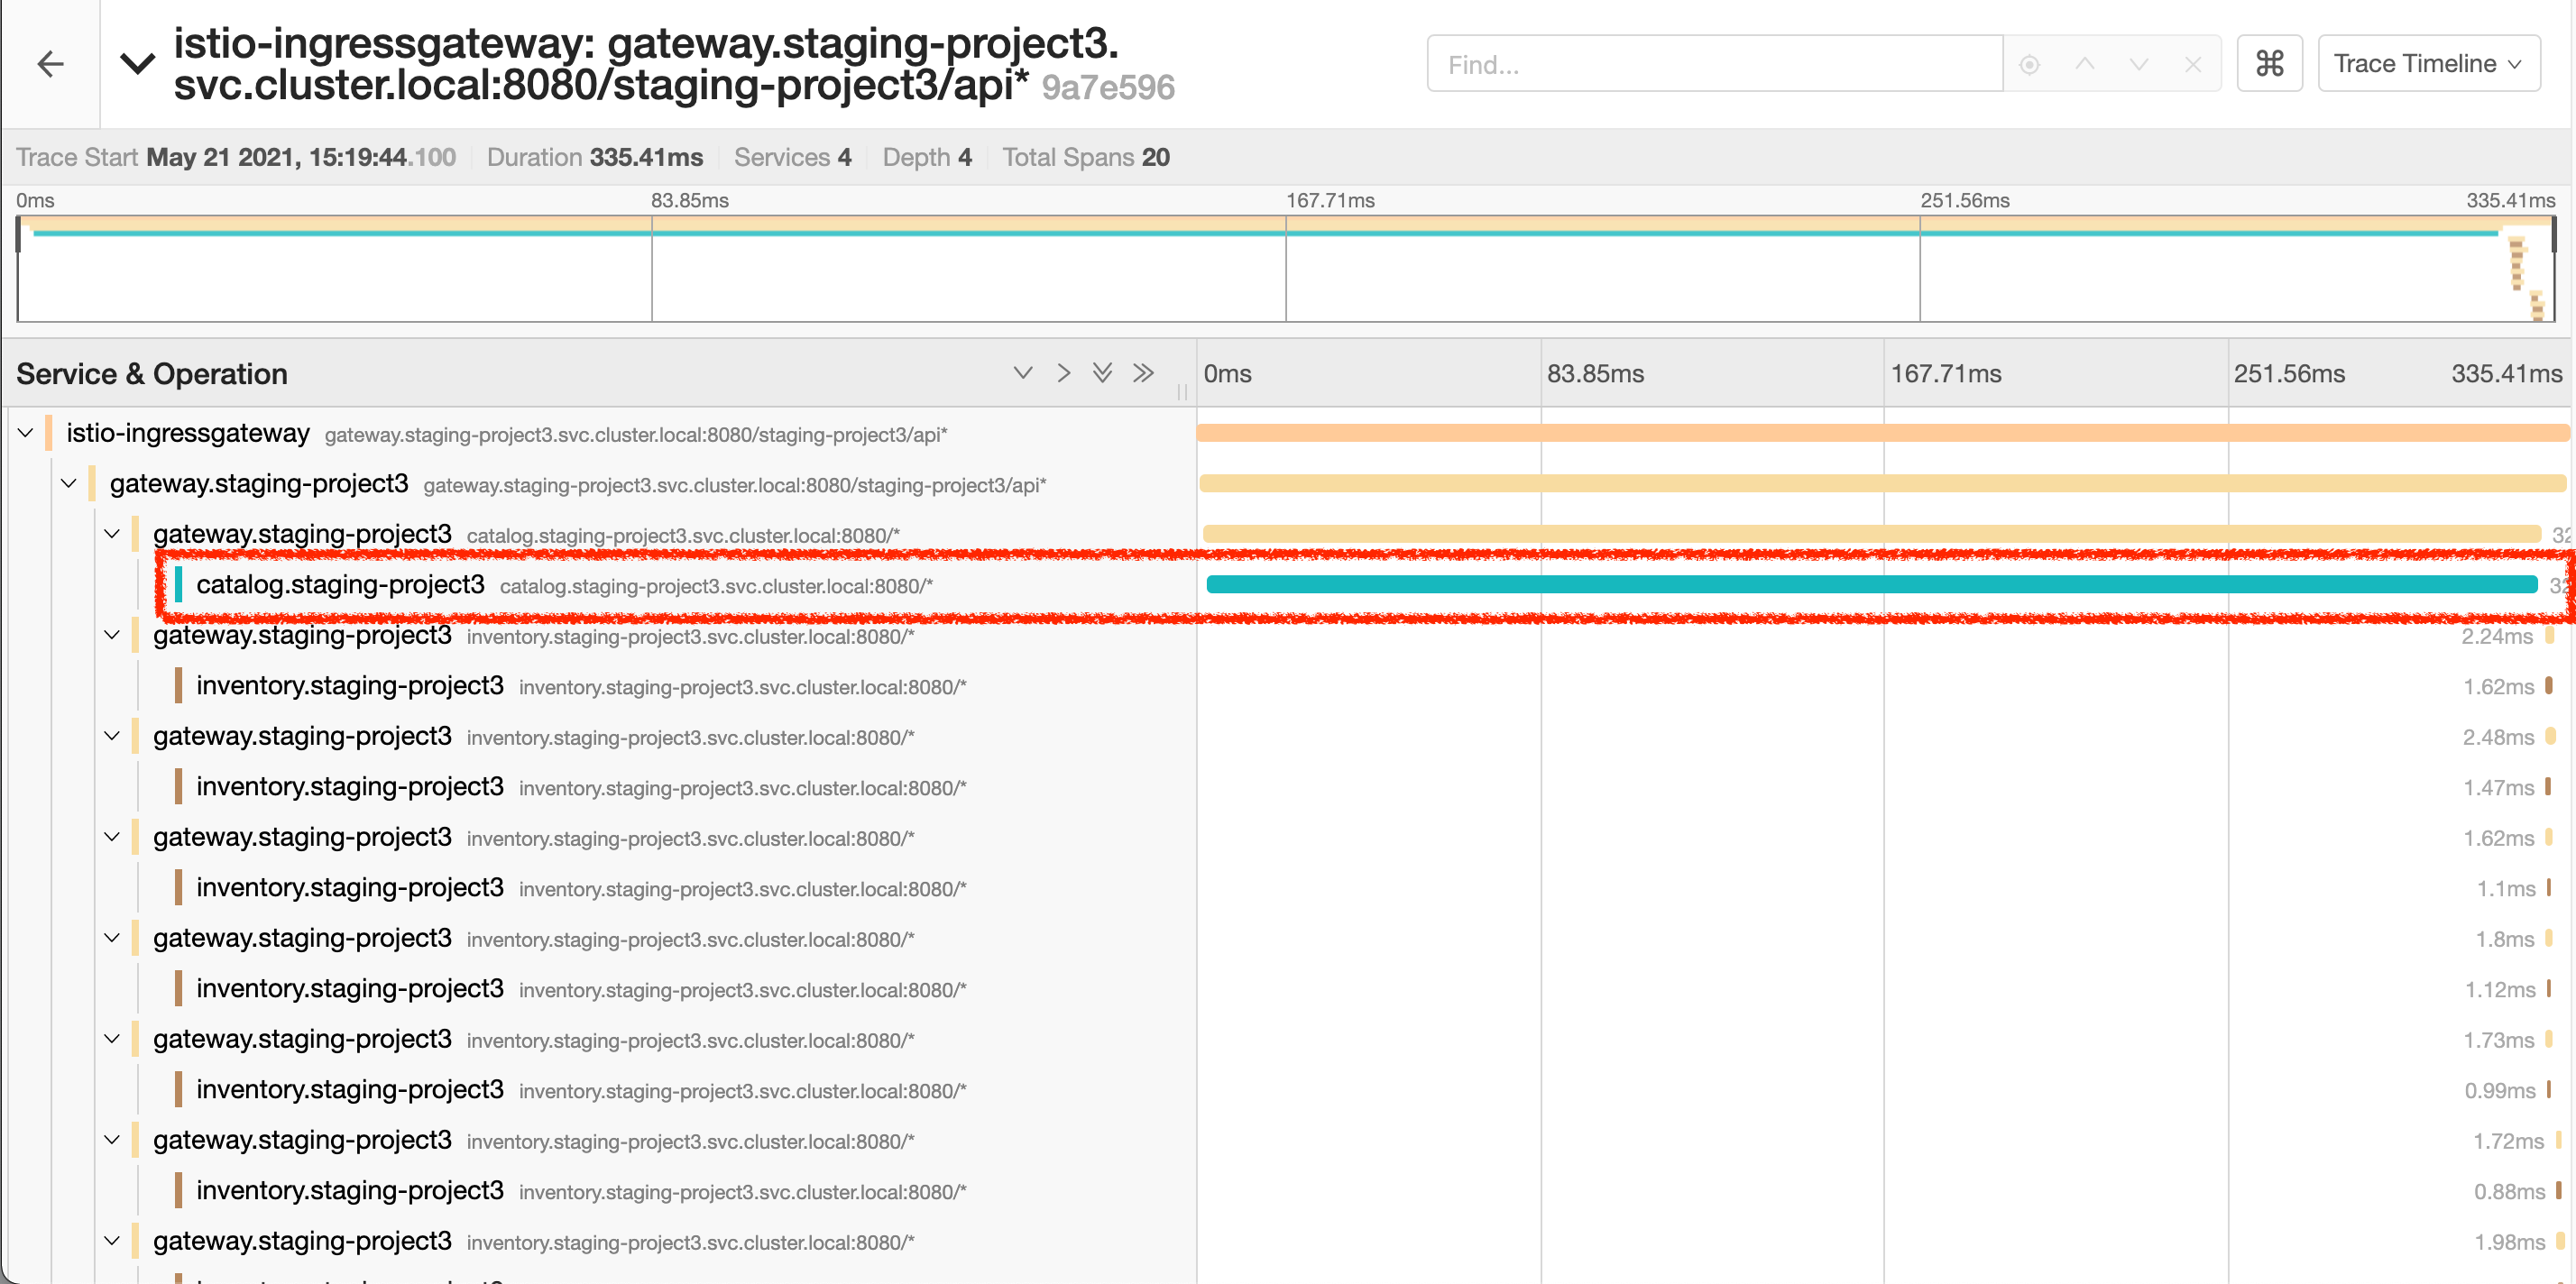
Interesting … The major part of a call is consuming by the Catalog Service. Let’s continue the investigation on the source code side.
In your Workspace,
Examine 'com.redhat.cloudnative.catalog.CatalogController' class in the /projects/workshop/catalog-spring-boot/src/main directory:
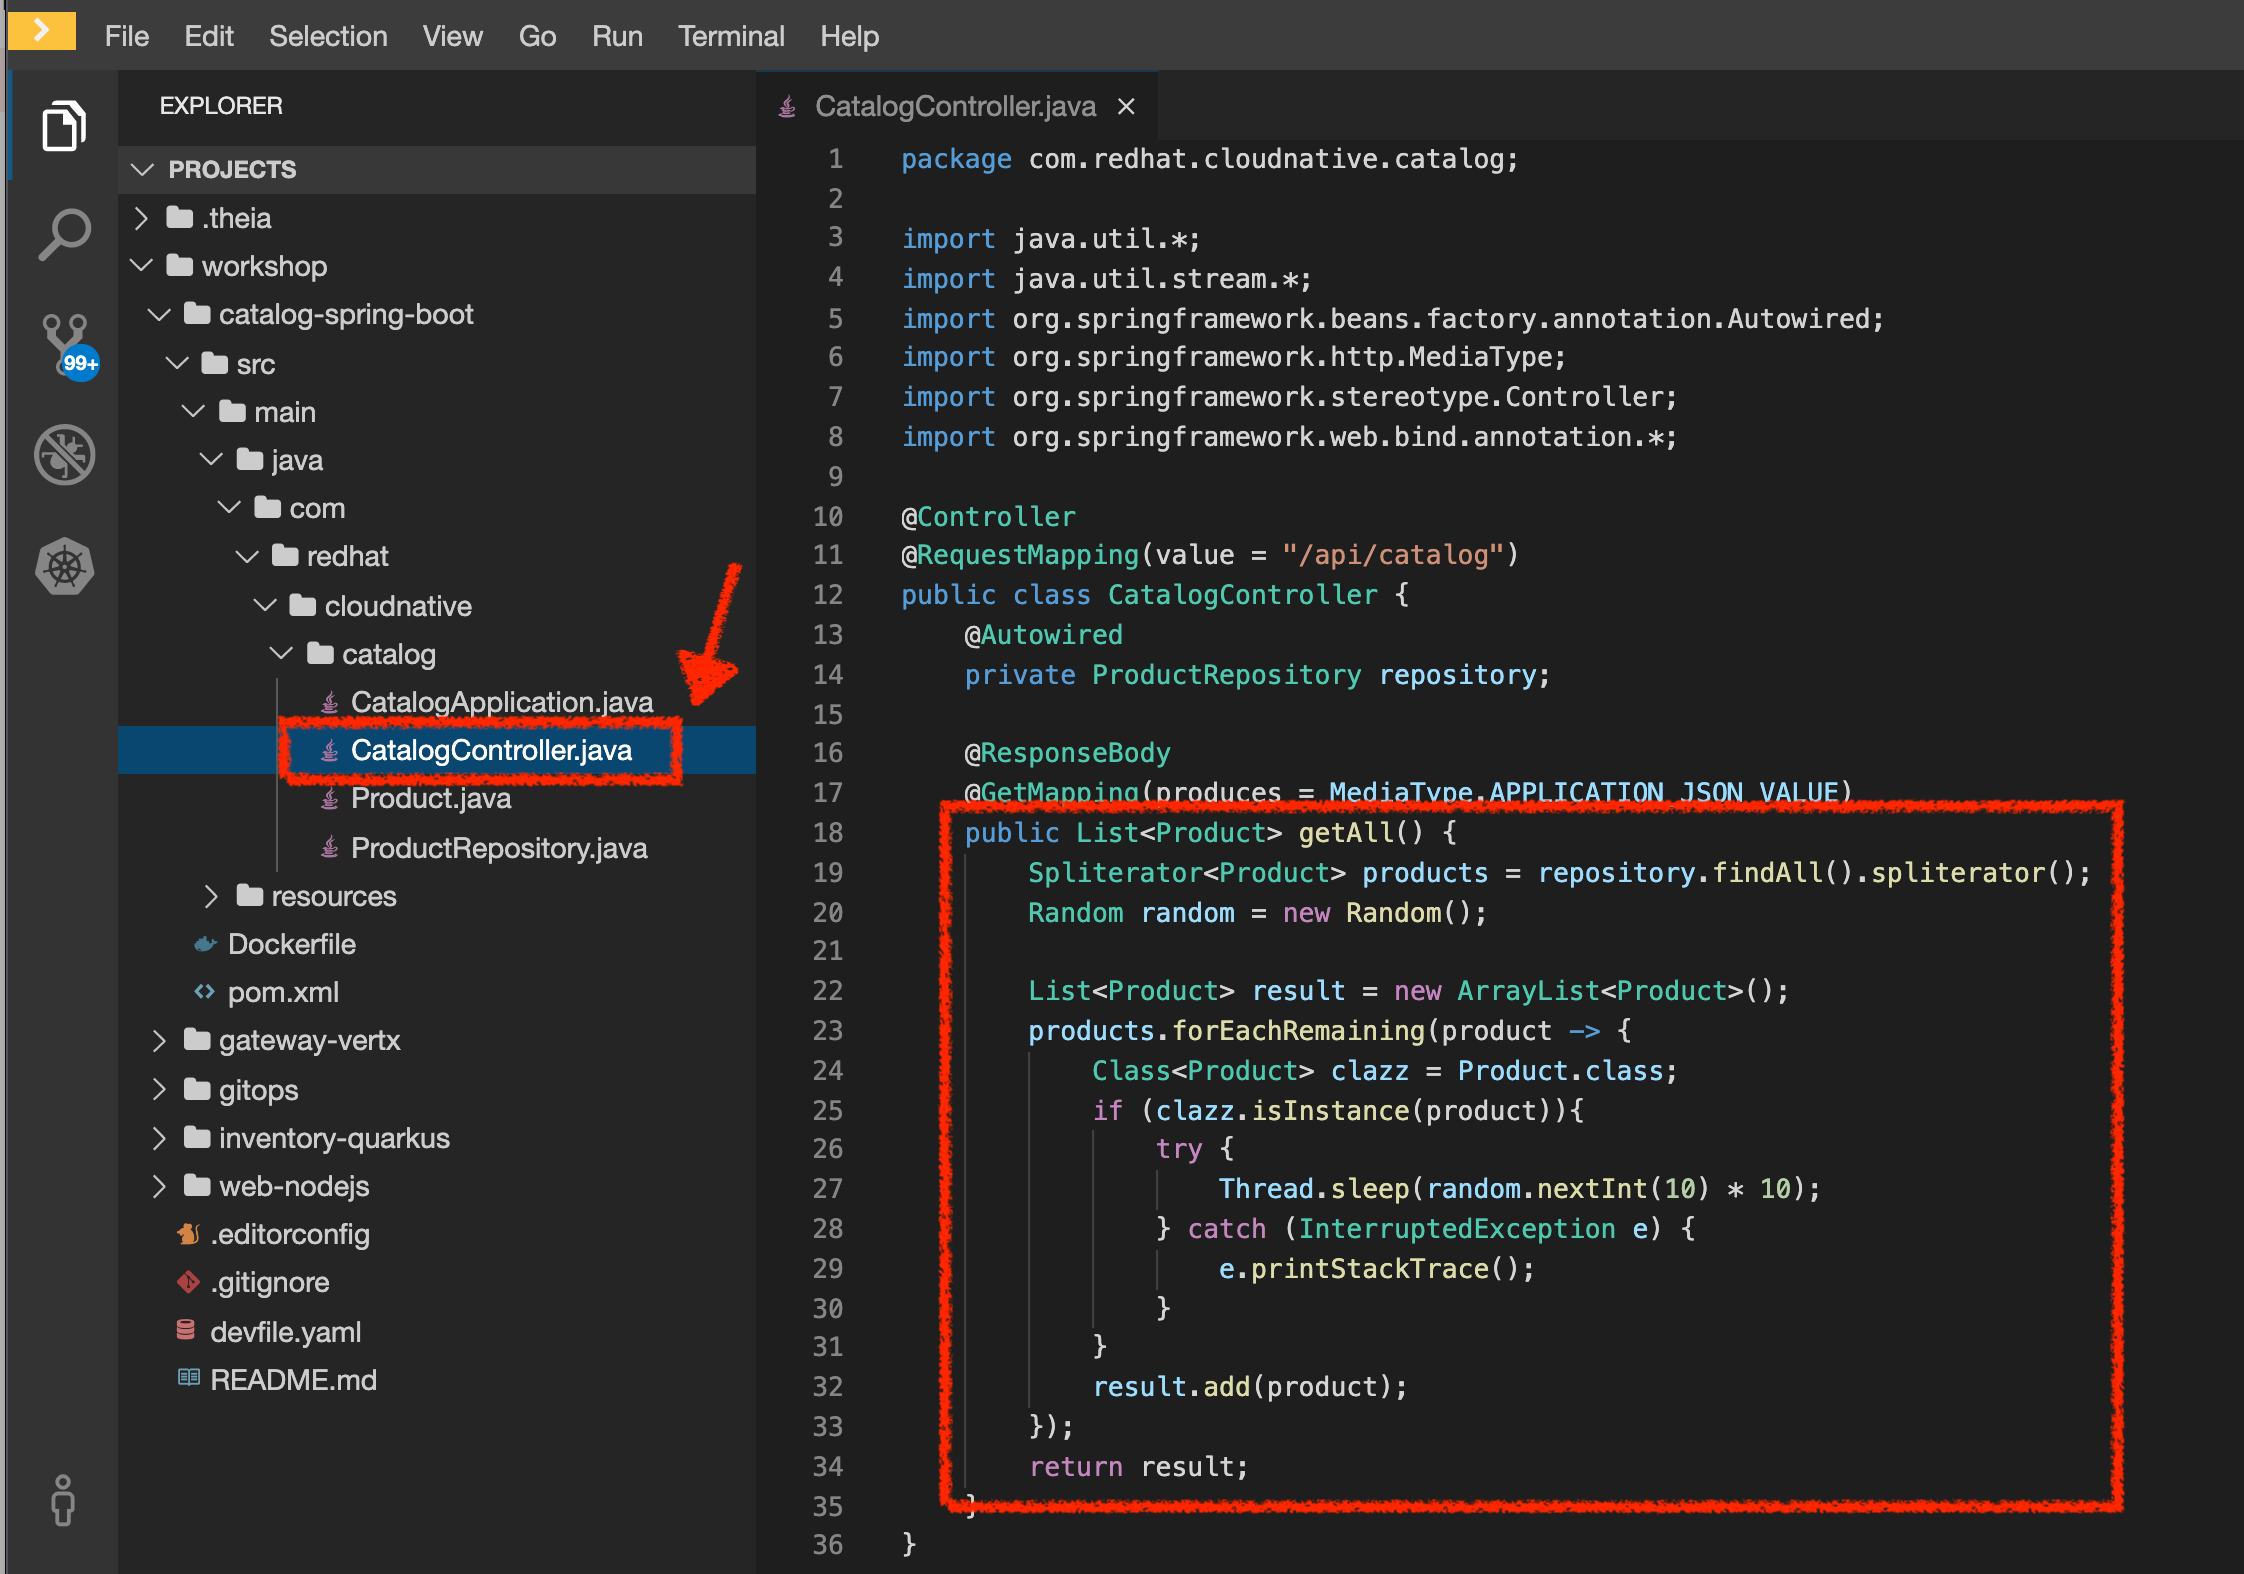
And yes, this burns your eyes, right?! There is a random pause in the execution of current thread (Thread.sleep(random.nextInt(10) * 10)) and basically it is complicated to understand what the developer attempted to achieve.
This piece of code is a part of the getAll() method which returns the list of all products from the database. As you are a Java expert, you are about to create a masterpiece by both simplifying the code and increasing performance.
To fix it, we will use a new tool called Istio Workspace.
Route the traffic on your local workspace
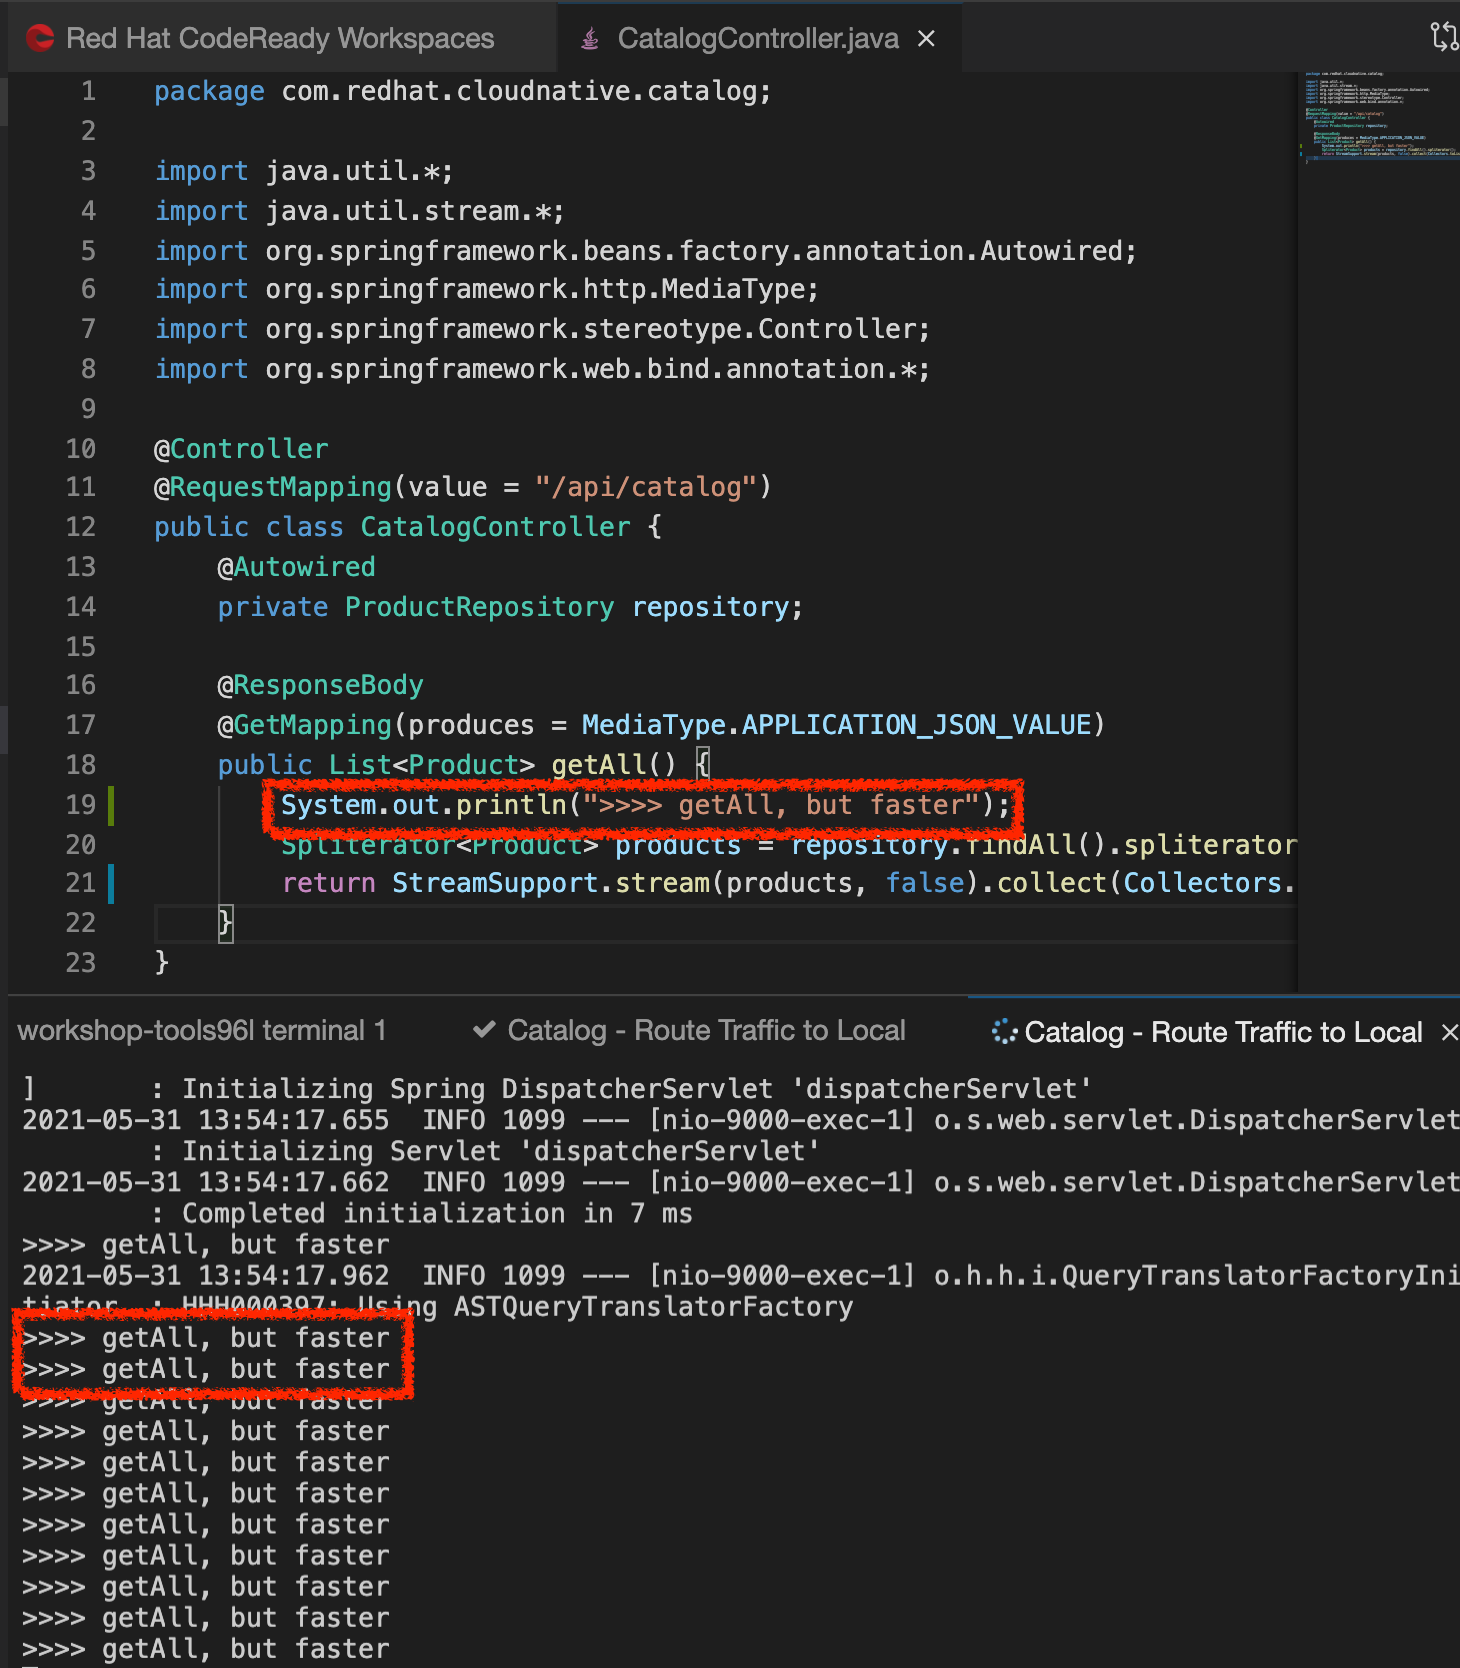
First we have to fix the problem. `Replace the content of the 'getAll()' method`as following:
@ResponseBody
@GetMapping(produces = MediaType.APPLICATION_JSON_VALUE)
public List<Product> getAll() {
    System.out.println(">>>> getAll, but faster");
    Spliterator<Product> products = repository.findAll().spliterator();
    return StreamSupport.stream(products, false).collect(Collectors.toList());
}
With those changes in place we can now test it. But does it mean we have to go through the whole build and test locally → deploy and test on OpenShift cycle? That can take a couple of minutes. Luckily, with Istio Workspace, we can now start service with our changes locally, but in a way like it would be running as part of the application in OpenShift.
In your Workspace,
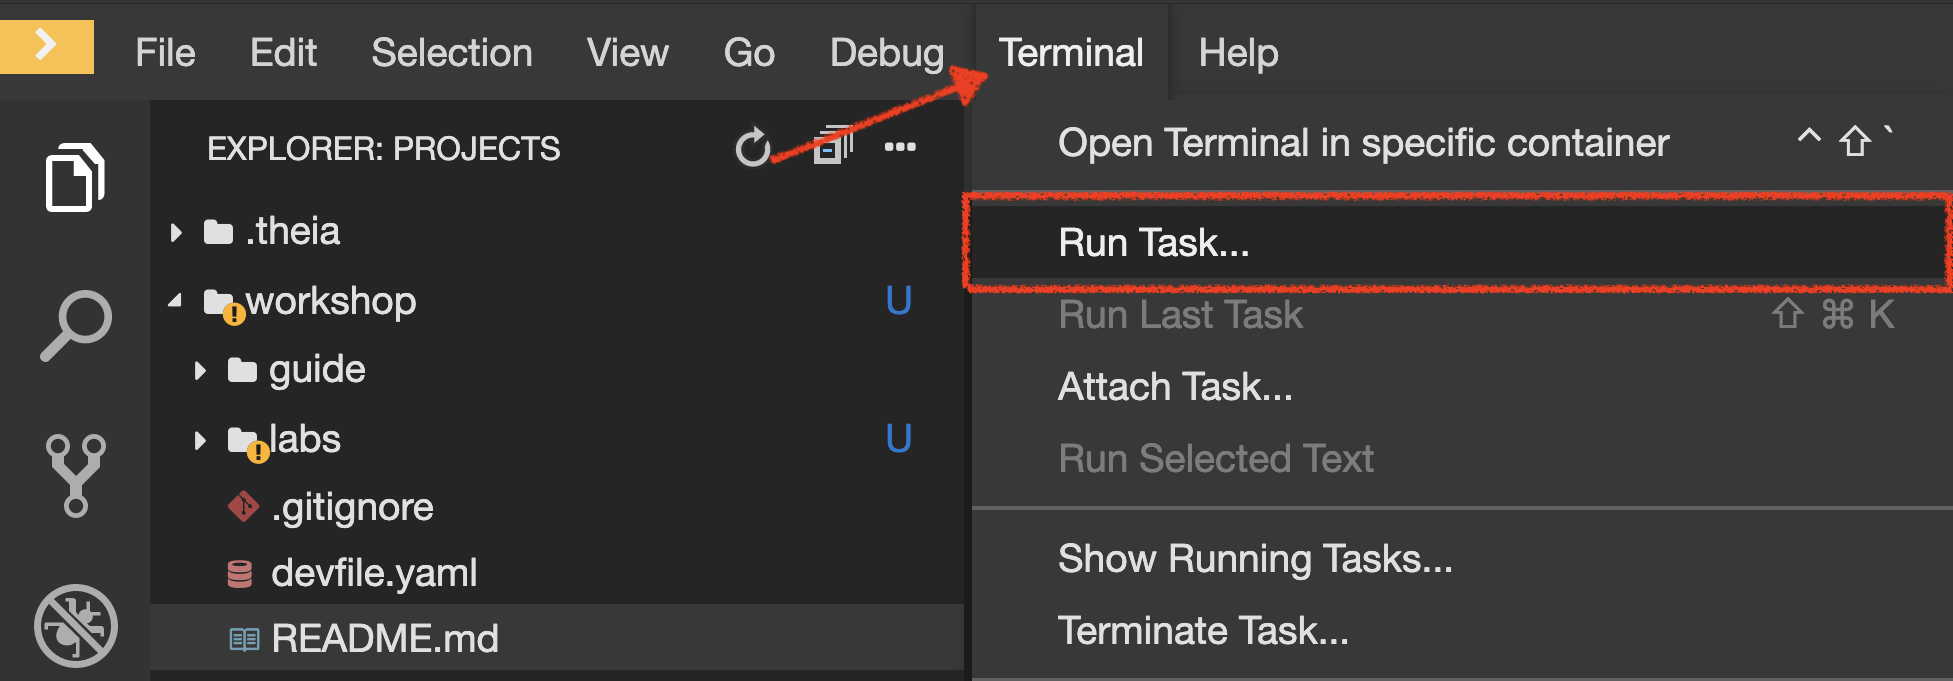
Click on 'Terminal' → 'Run Task…' → 'Catalog - Route Traffic to local'
Execute the following commands in the '>_ workshop_tools' terminal window
To open a '>_ workshop_tools' terminal window, click on 'Terminal' → 'Open Terminal in specific container' → 'workshop-tools'
|
cd /projects/workshop/catalog-spring-boot
ike develop \
    --deployment catalog-v1 \
    --run 'mvn spring-boot:run' \
    --port 9000:8080 \
    --route header:ike-session-id=dist_trace
you kill all current ike process with the command: pkill ike
|
This command will deploy a new version of the service which you can access by using special routing header.
Test the new version
As we have our improved service already up and running, it’s time to test the new version. You can now access application through web interface by adding /?route=dist_trace query parameter to the URL of deployed app:
http://web-staging-project%USER_ID%.%APPS_HOSTNAME_SUFFIX%/#!/?route=dist_trace| route=dist_trace is not automatically added by Istio Workspace. This parameter, like any other should be handled (and appropriately propagated) by the application itself. |
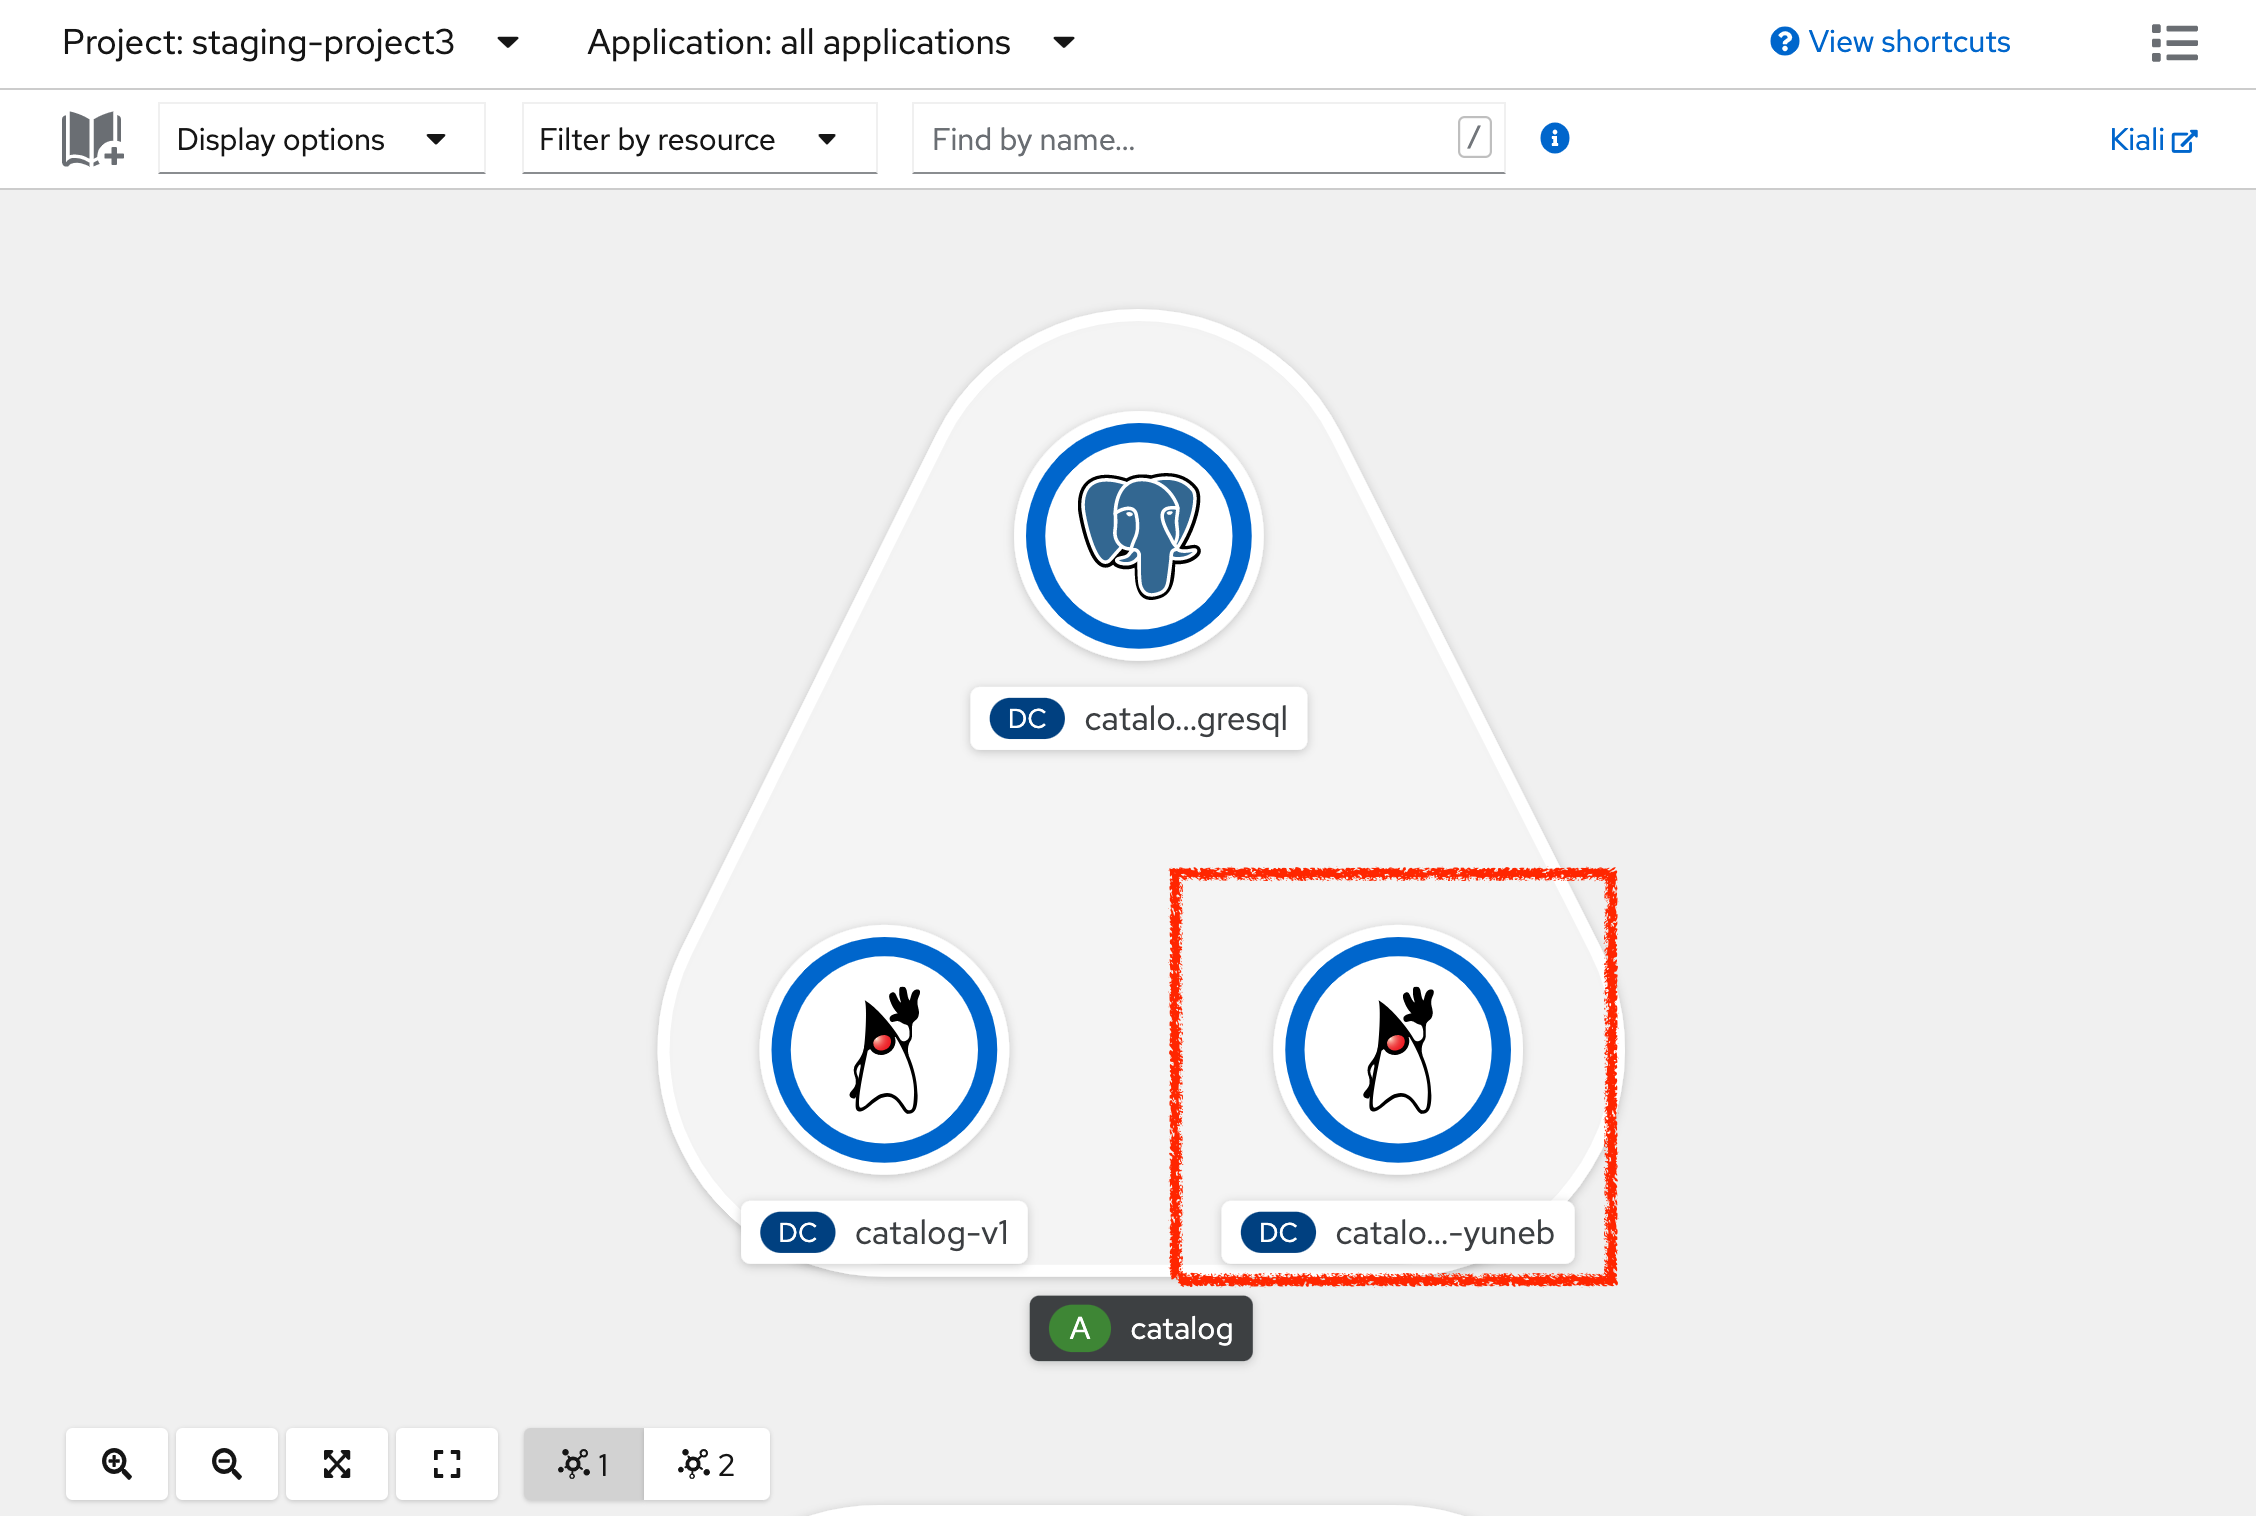
From Kiali, in the 'Graph' view, check the new traffic
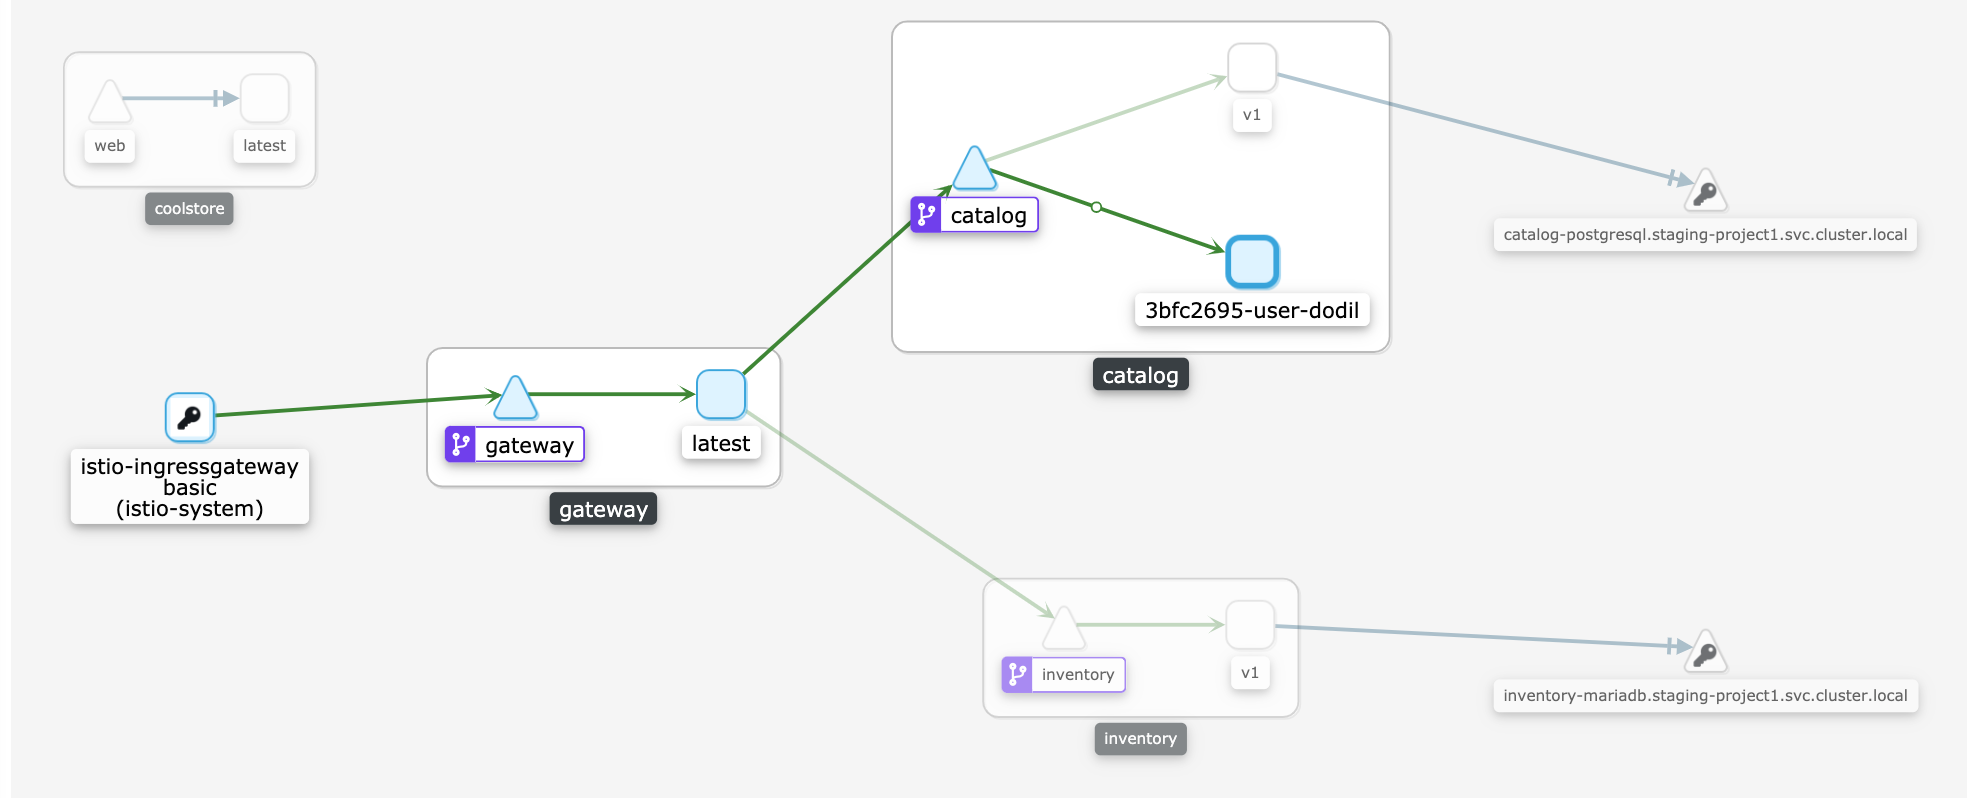
The traffic is directed to the new version of the Catalog service, but will keep all the other users still relying on the last deployed version. Sadly, they will be still affected by the performance regression we just fixed.
We can also see directly in the console of your Workspace, that our service has been accessed, as we are printing a test message every single time CatalogController is accessed now.
Moreover, we can see improvements in the response time as well:
Just wonderful! You reduced the response time by a factor of 5! You should be proud!
You can now stop the "Catalog - Route Traffic to Local" (ike) process in the terminal by pressing Ctrl+C. This will result in undeploying our special instance which we just used for debugging purposes.
Now, it is time to go deeper again!!