Debugger, please Help Me!
20 MINUTES PRACTICE
After checking logs and traces we need the ability to do live debugging of my application, it’s an essential piece in the development process. It’s time to enter the running system.
What is Kibana?
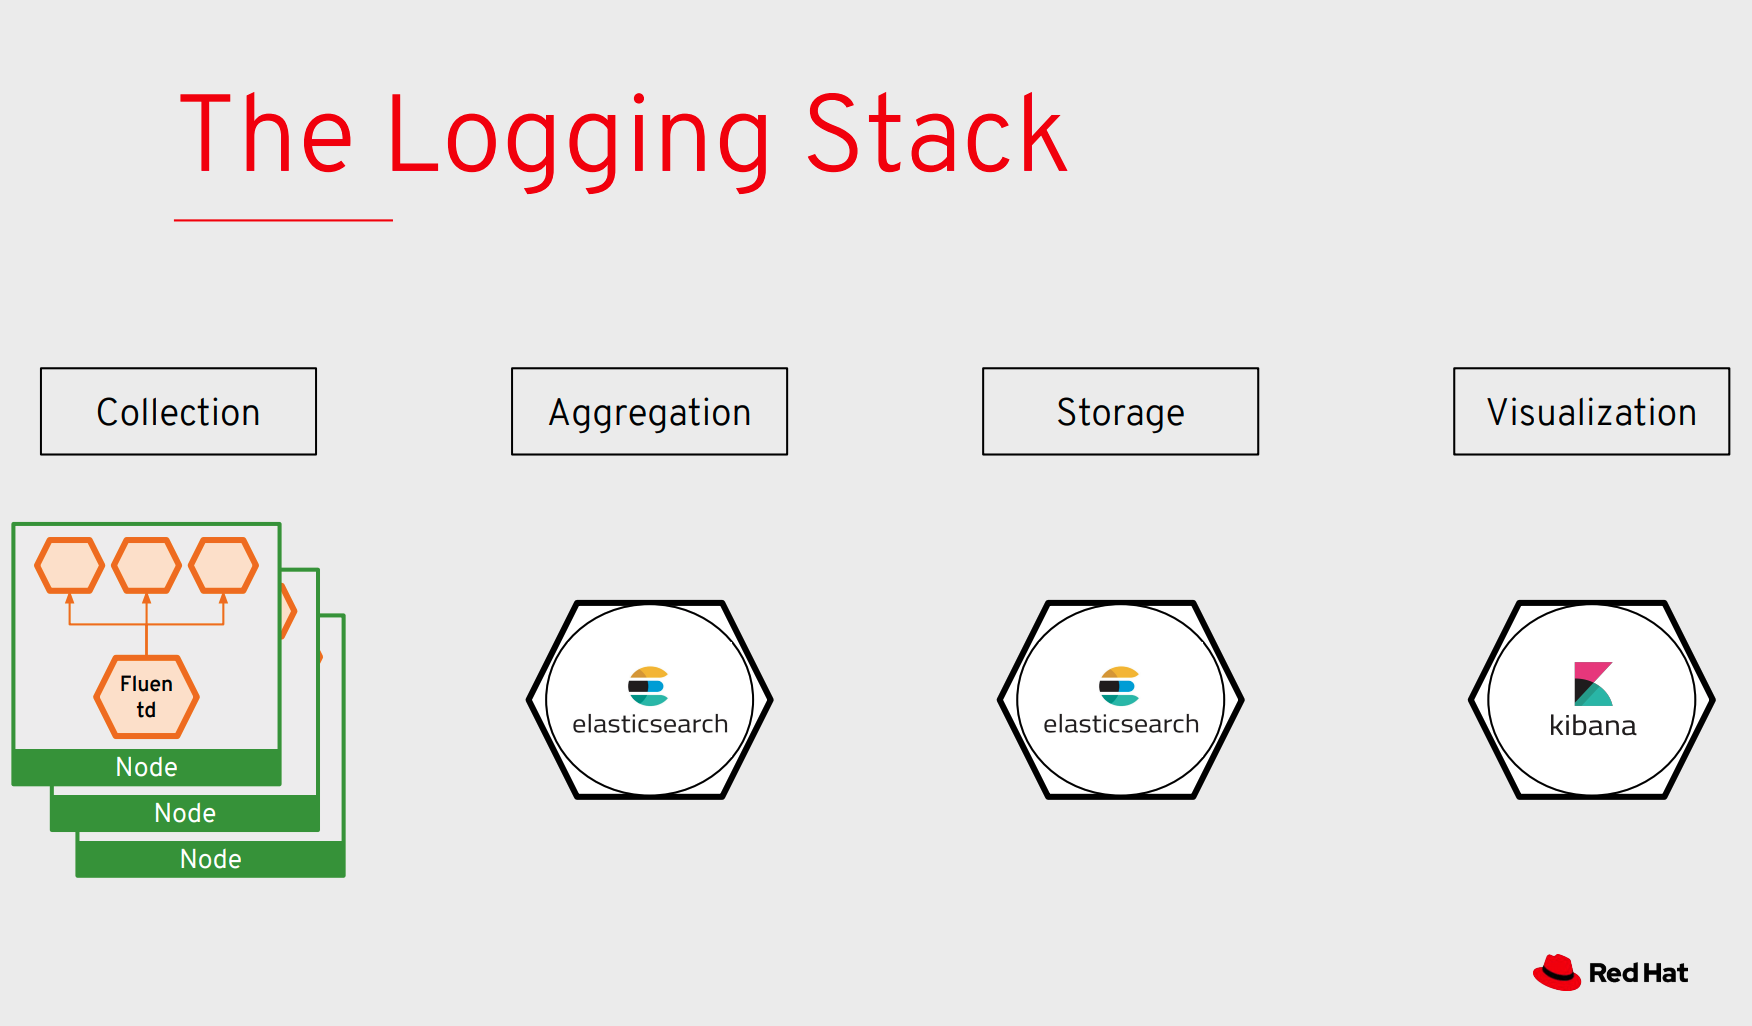
OpenShift provides a logging solution based on ElasticSearch, Fluentd, and Kibana :
-
Fluentd which serves as both the collector and the normalizer,
-
Elasticsearch serves as the warehouse (aggregation and storage), and
-
Kibana is the visualizer (web UI). Kibana is a Node.js application. It works very well with Elasticsearch and is tightly coupled to it.
The logging system can provide two views:
-
Project logs - access controlled view to specific project logs for running containers and project resources. Our case in this Workshop.
-
Ops view - aggregate logging of all projects across the cluster, in addition to platform logs (nodes, docker, and masters, for example).
Log management plays a vital role when we encounter an error in the application. If we do not manage the logs, it will be difficult in any application, especially in microservices architecture, to find the problem and fix it. For our application with lots of microservices we have to identify interesting traces and Kibana is offering nice User Interface with a search field to explore and to analyze logs files easily. Whenever we get some error in the application(s), we can get the error details and analyze them in a simple way.
Investigate The Bug
The coolStore application seems to have a bug that causes the inventory status for one of the products not to be displayed on the page.
This is not an expected behavior! Let’s start our investigation from the application logs!
Log in to the Kibana Console as user%USER_ID%/%OPENSHIFT_PASSWORD%
|
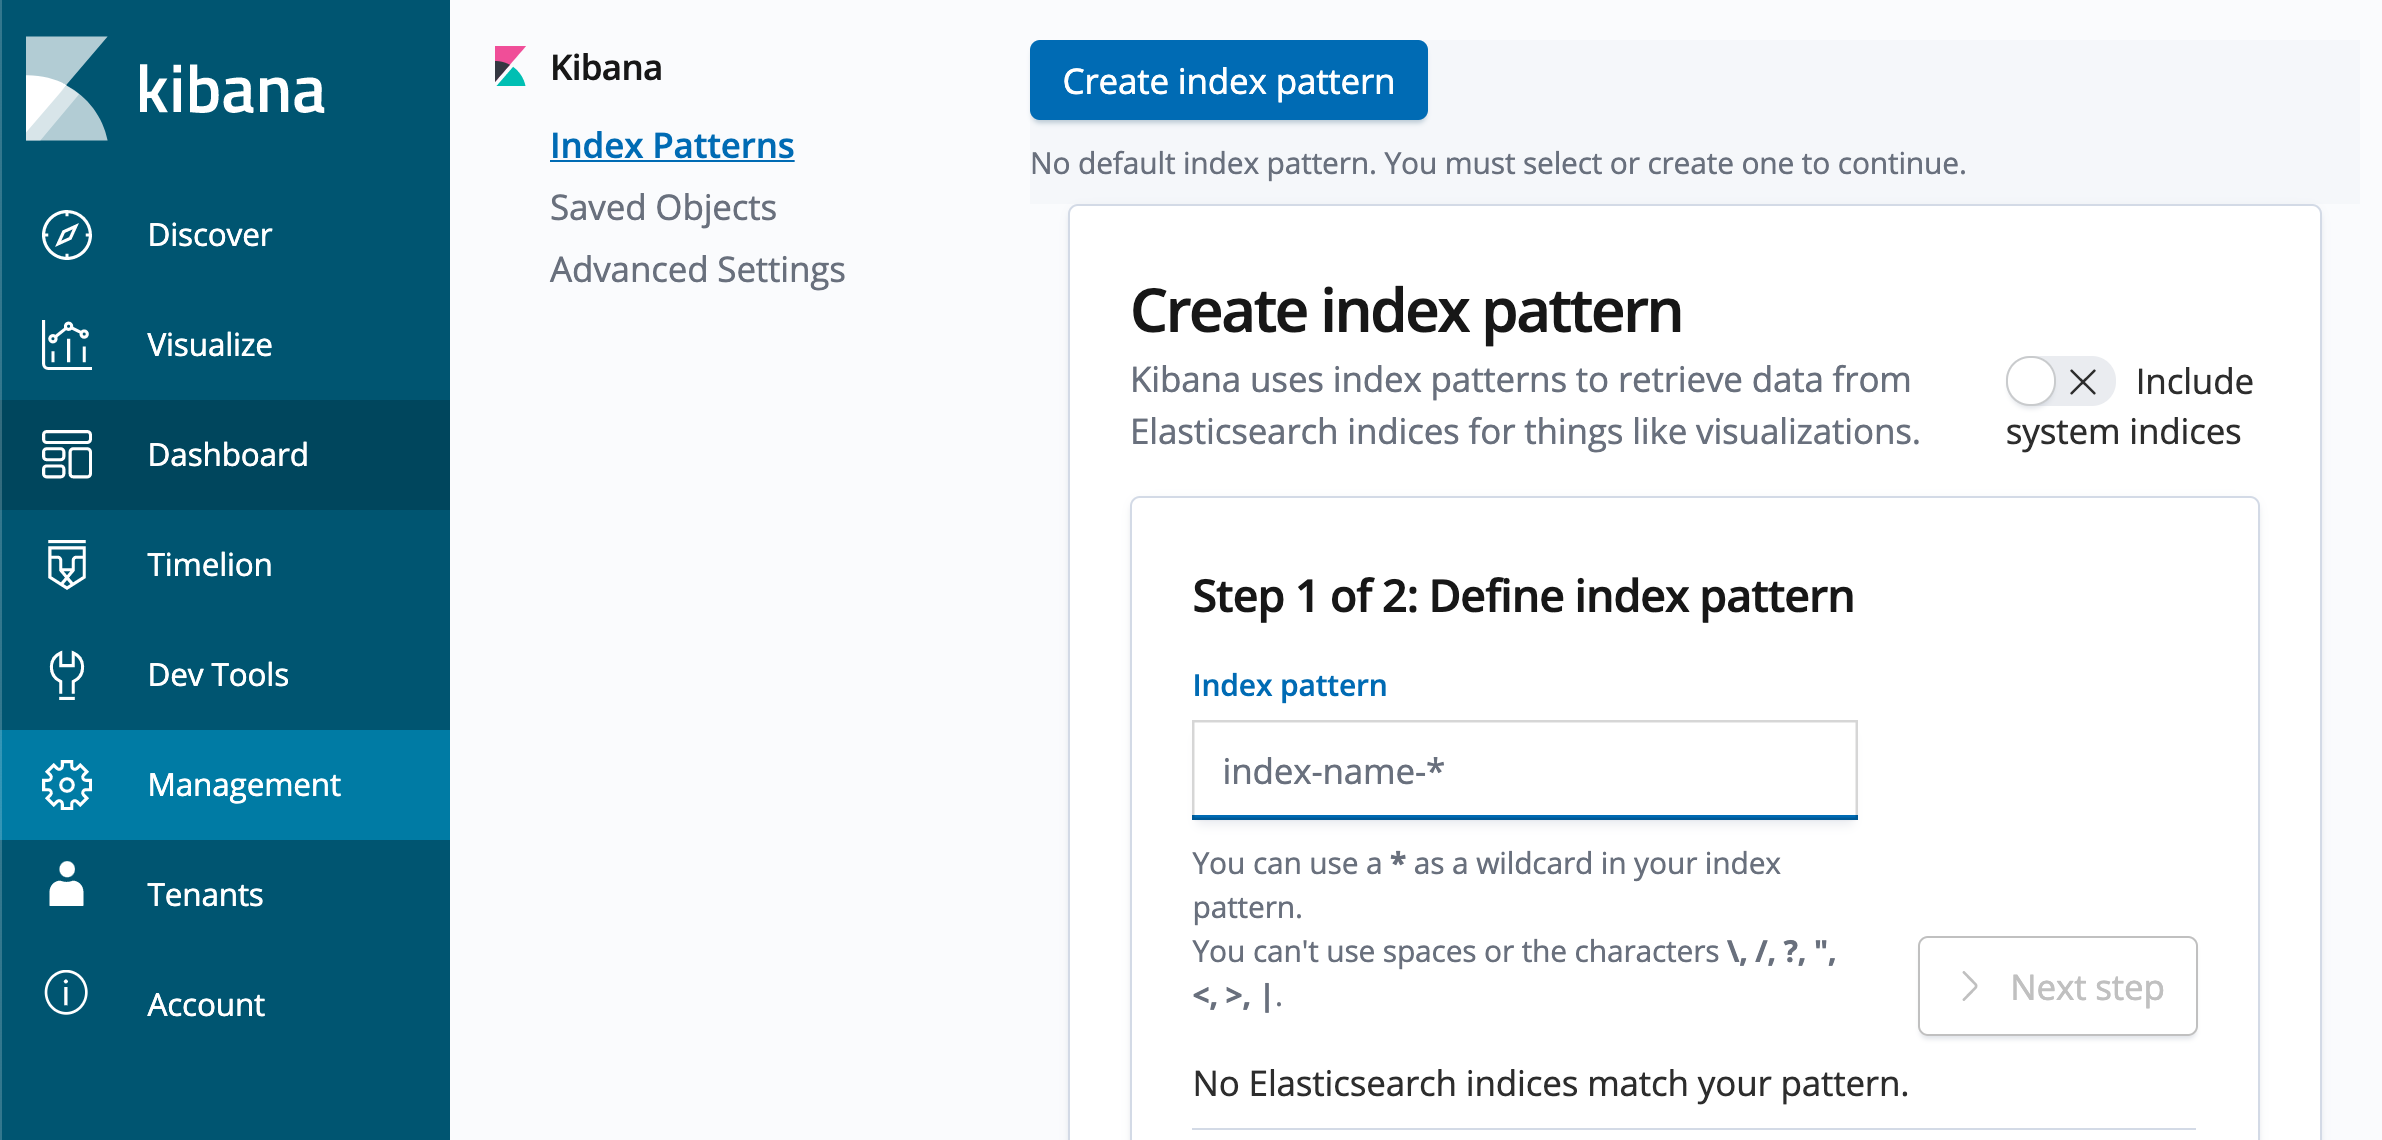
Kibana requires an index pattern to access the Elasticsearch data that you want to explore. An index pattern selects the data to use and allows you to define properties of the fields. |
After you log in, create an Index Pattern as follows:
At 'Step 1 of 2: Define index pattern', enter '*' in the 'Index Pattern' field.
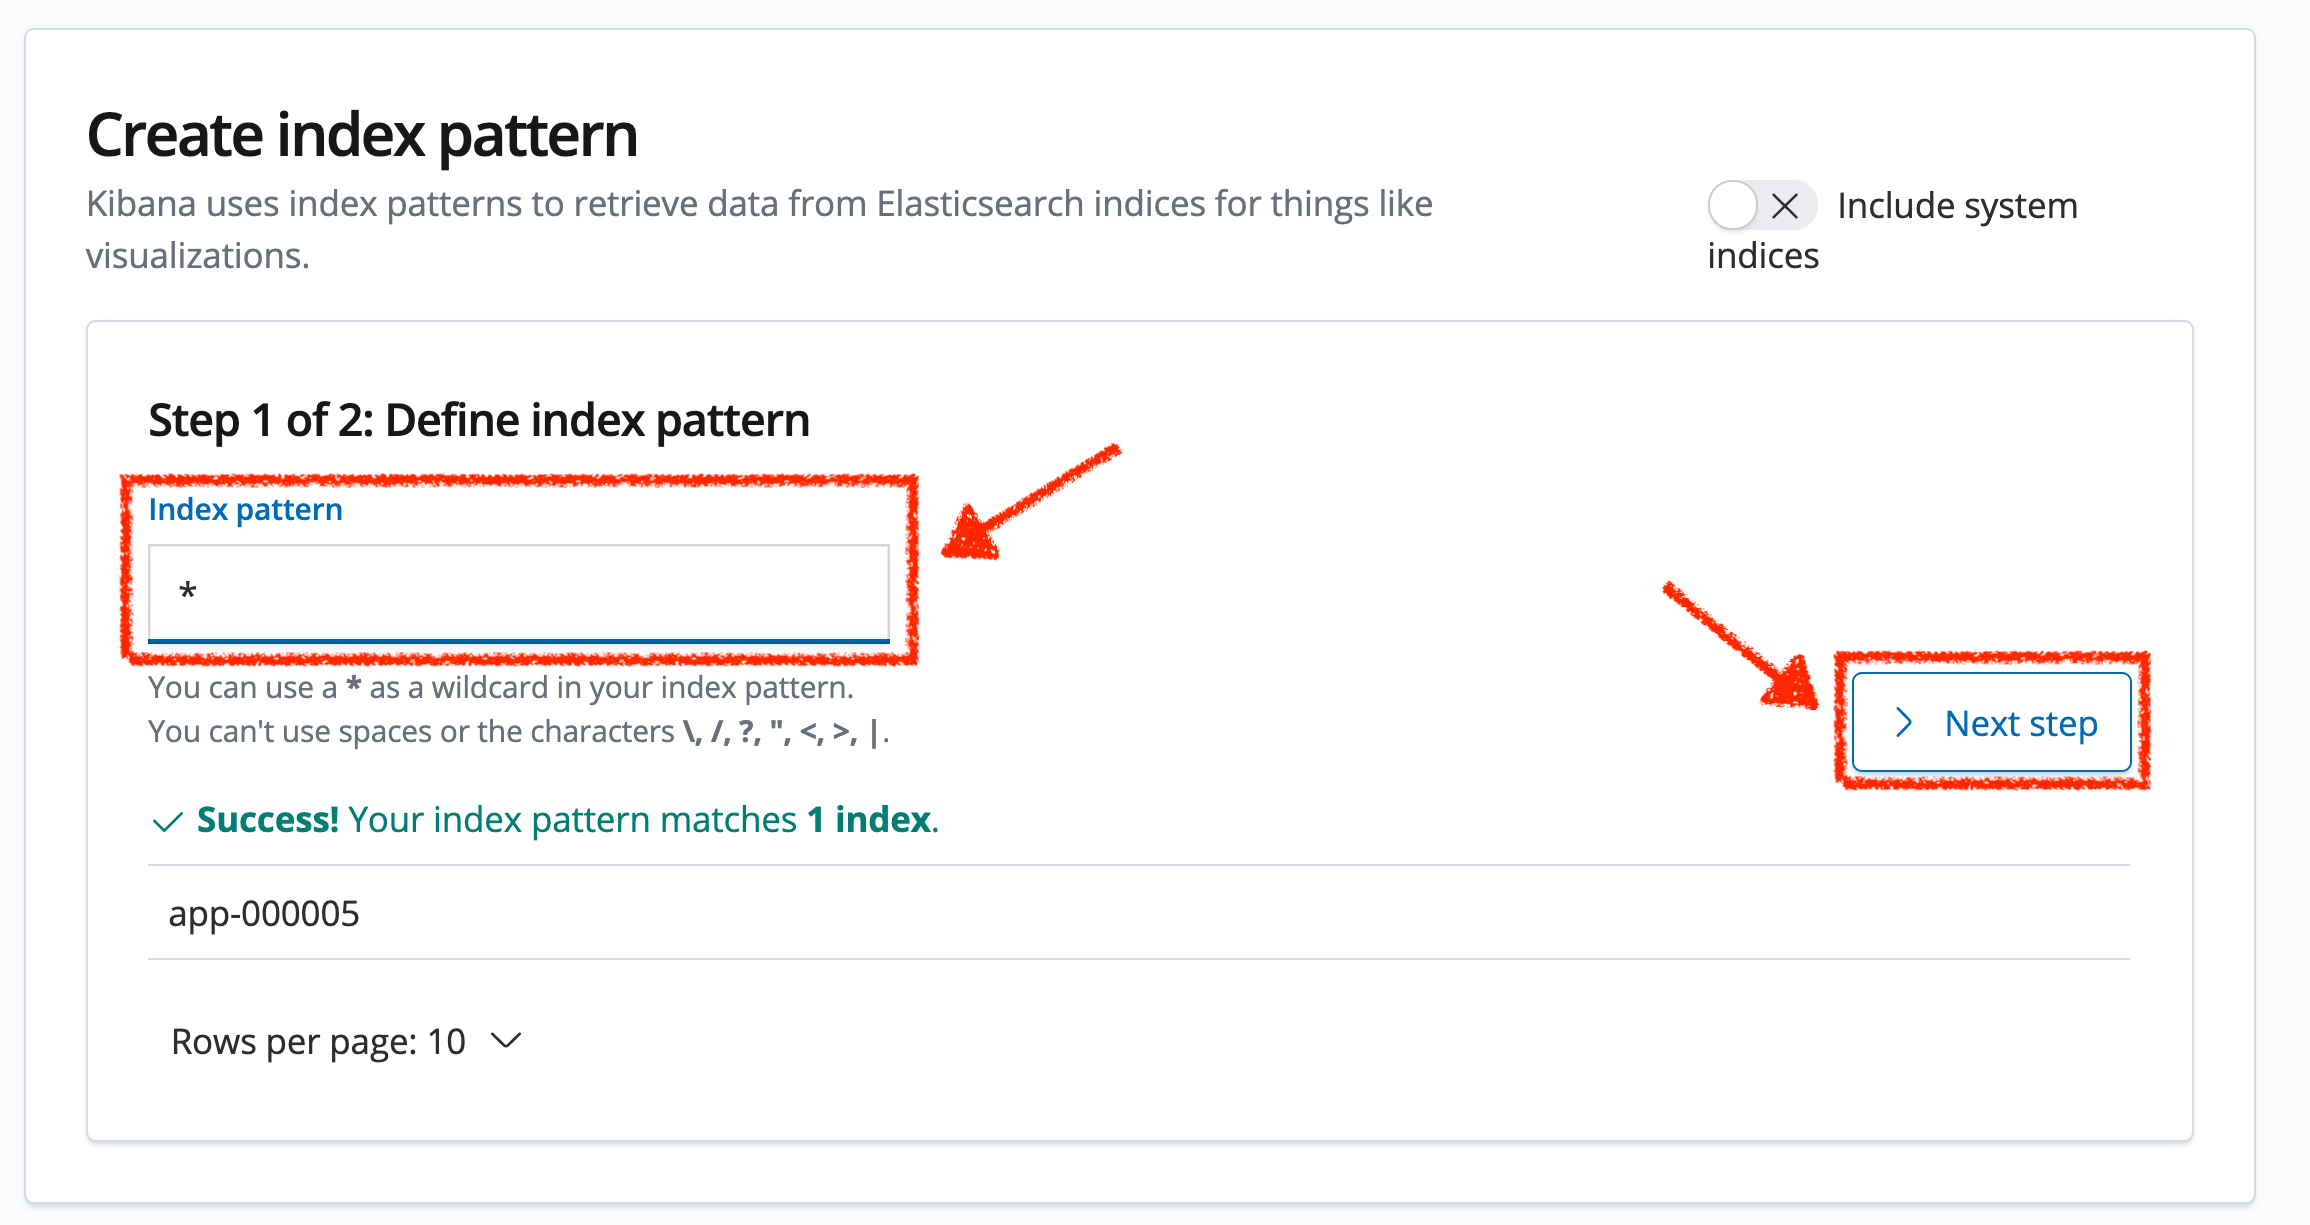
Then, click on '> Next Step'.
Next, At 'Step 2 of 2: Configure settings', select 'I don’t want to use the Time Filter' in the 'Time Filter field name' field.
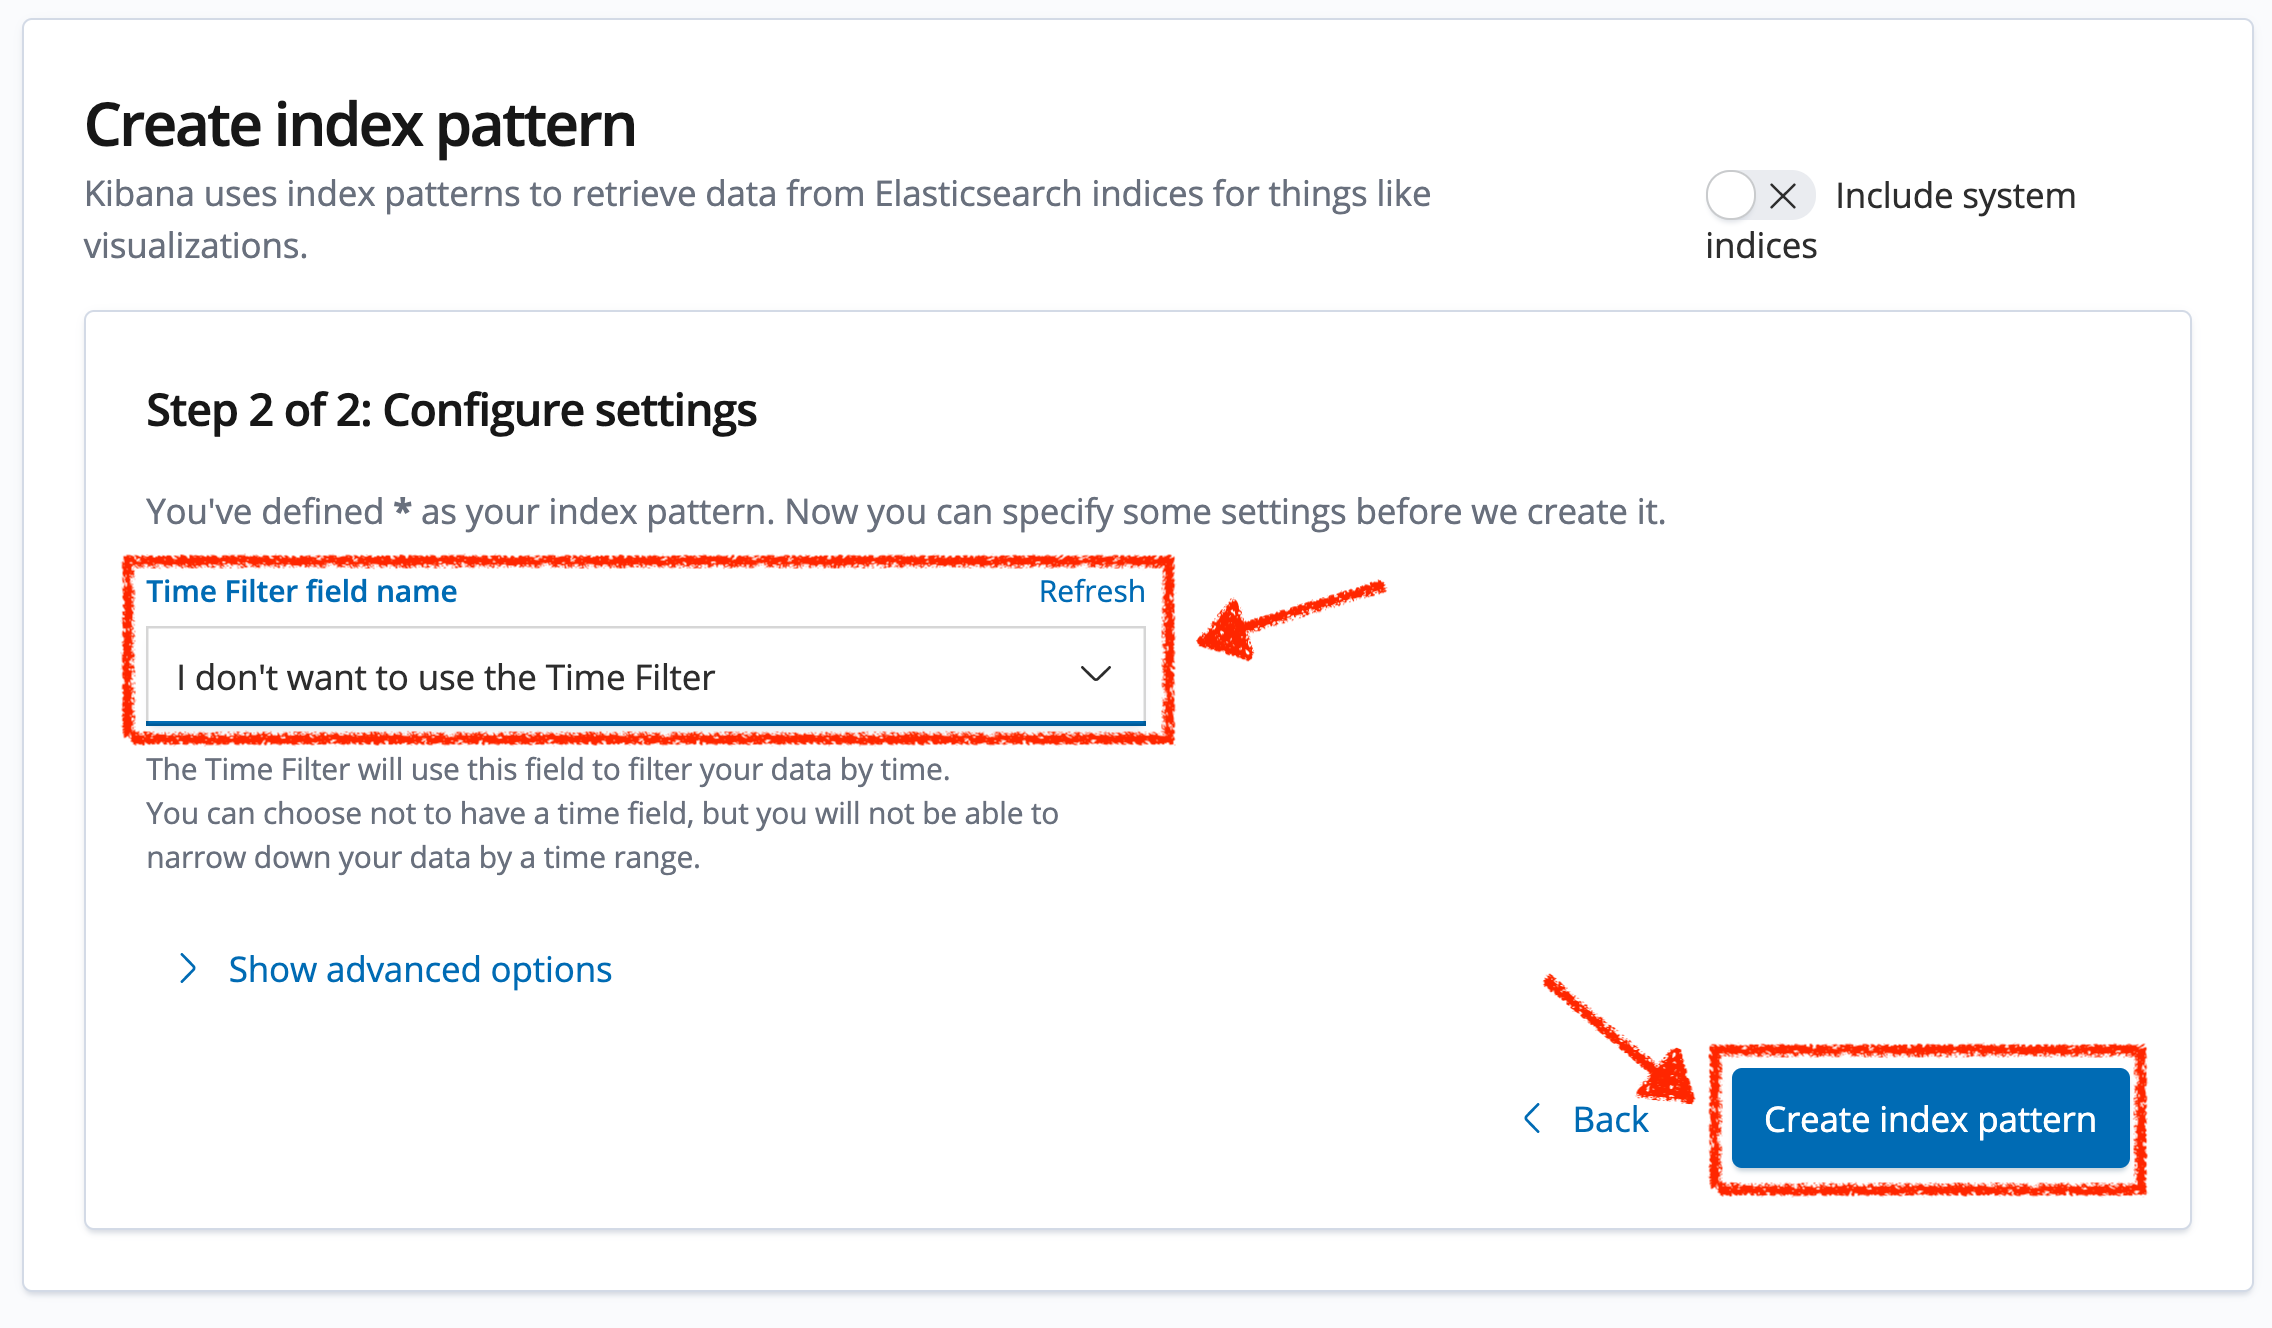
Finally, click on 'Create index pattern'. Now you can visualize and explore logs files easily.
For doing so, click on the 'Discover' menu and enter the following configuration:
| Parameter | Value |
|---|---|
Search |
message:(inventory AND error) |
Selected fields |
kubernetes.pod_name, message |
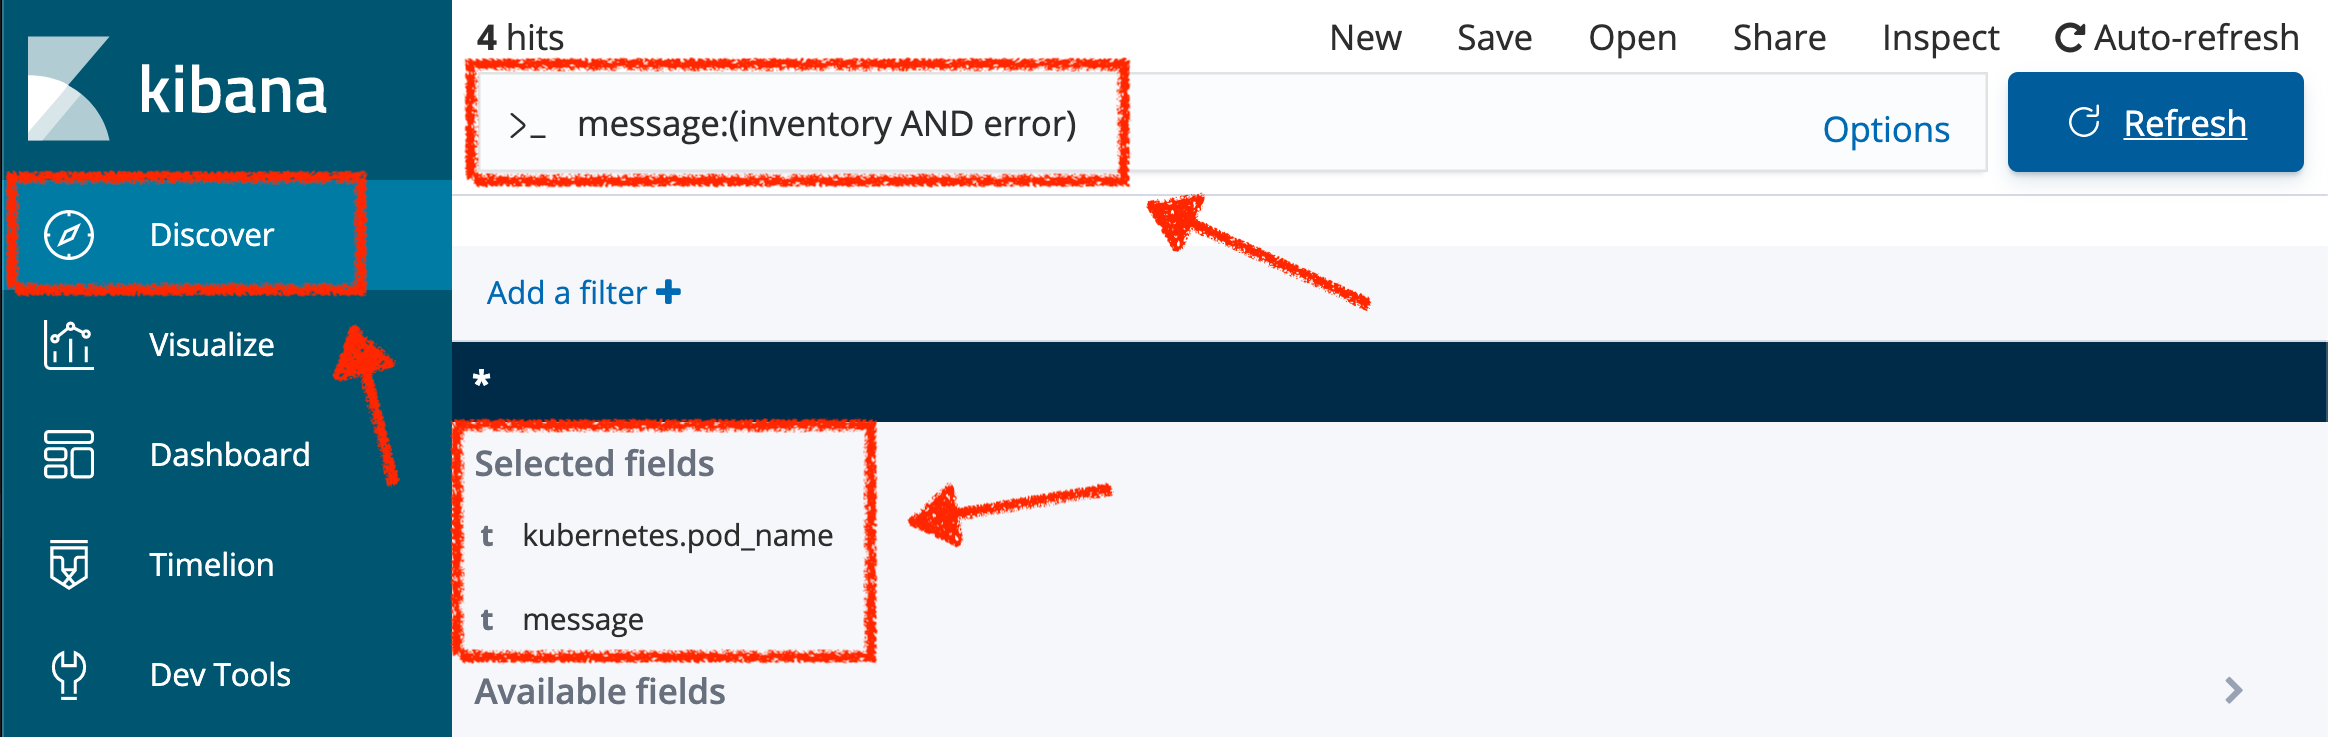
Press Enter, you will get the following results:
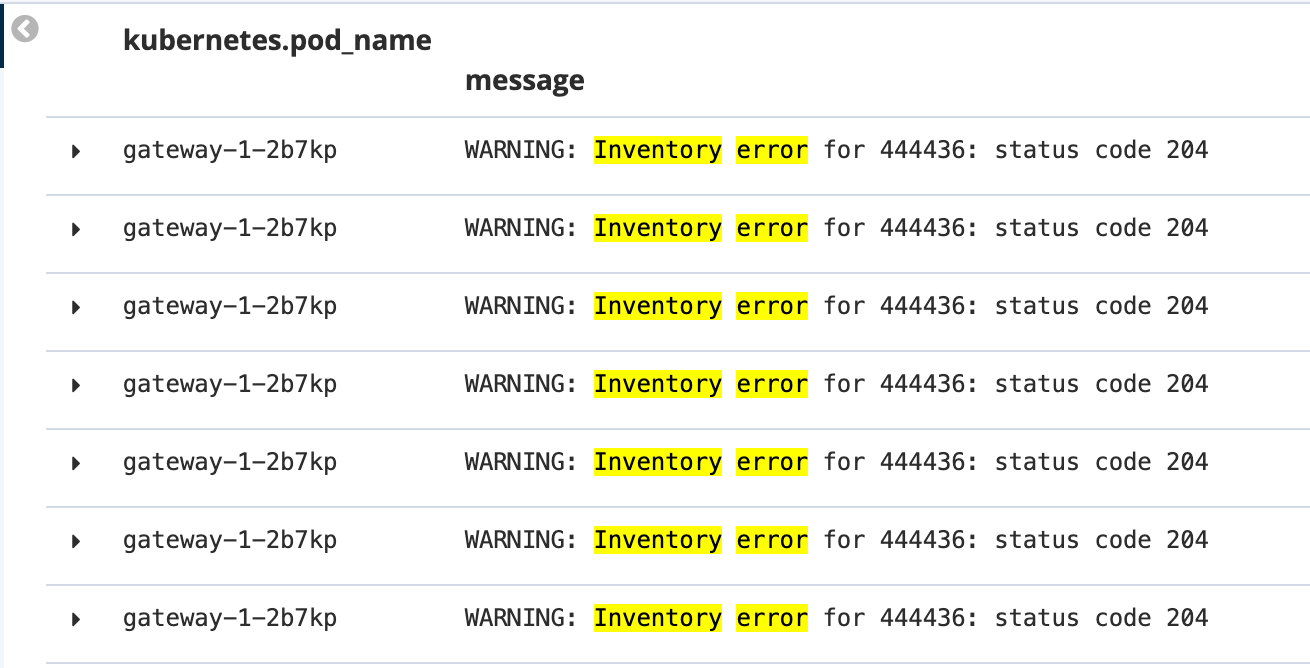
Oh! Something seems to be wrong with the response the Gateway Service has received from the Inventory Service for the product id '444436'. But there doesn’t seem to be anything relevant to the invalid response error at the Inventory Service level!
From Jaeger Console, select one of the trace and enter the product ID '444436' in the 'Find…' field on the top bar.
One span should be highlighted in light yellow.
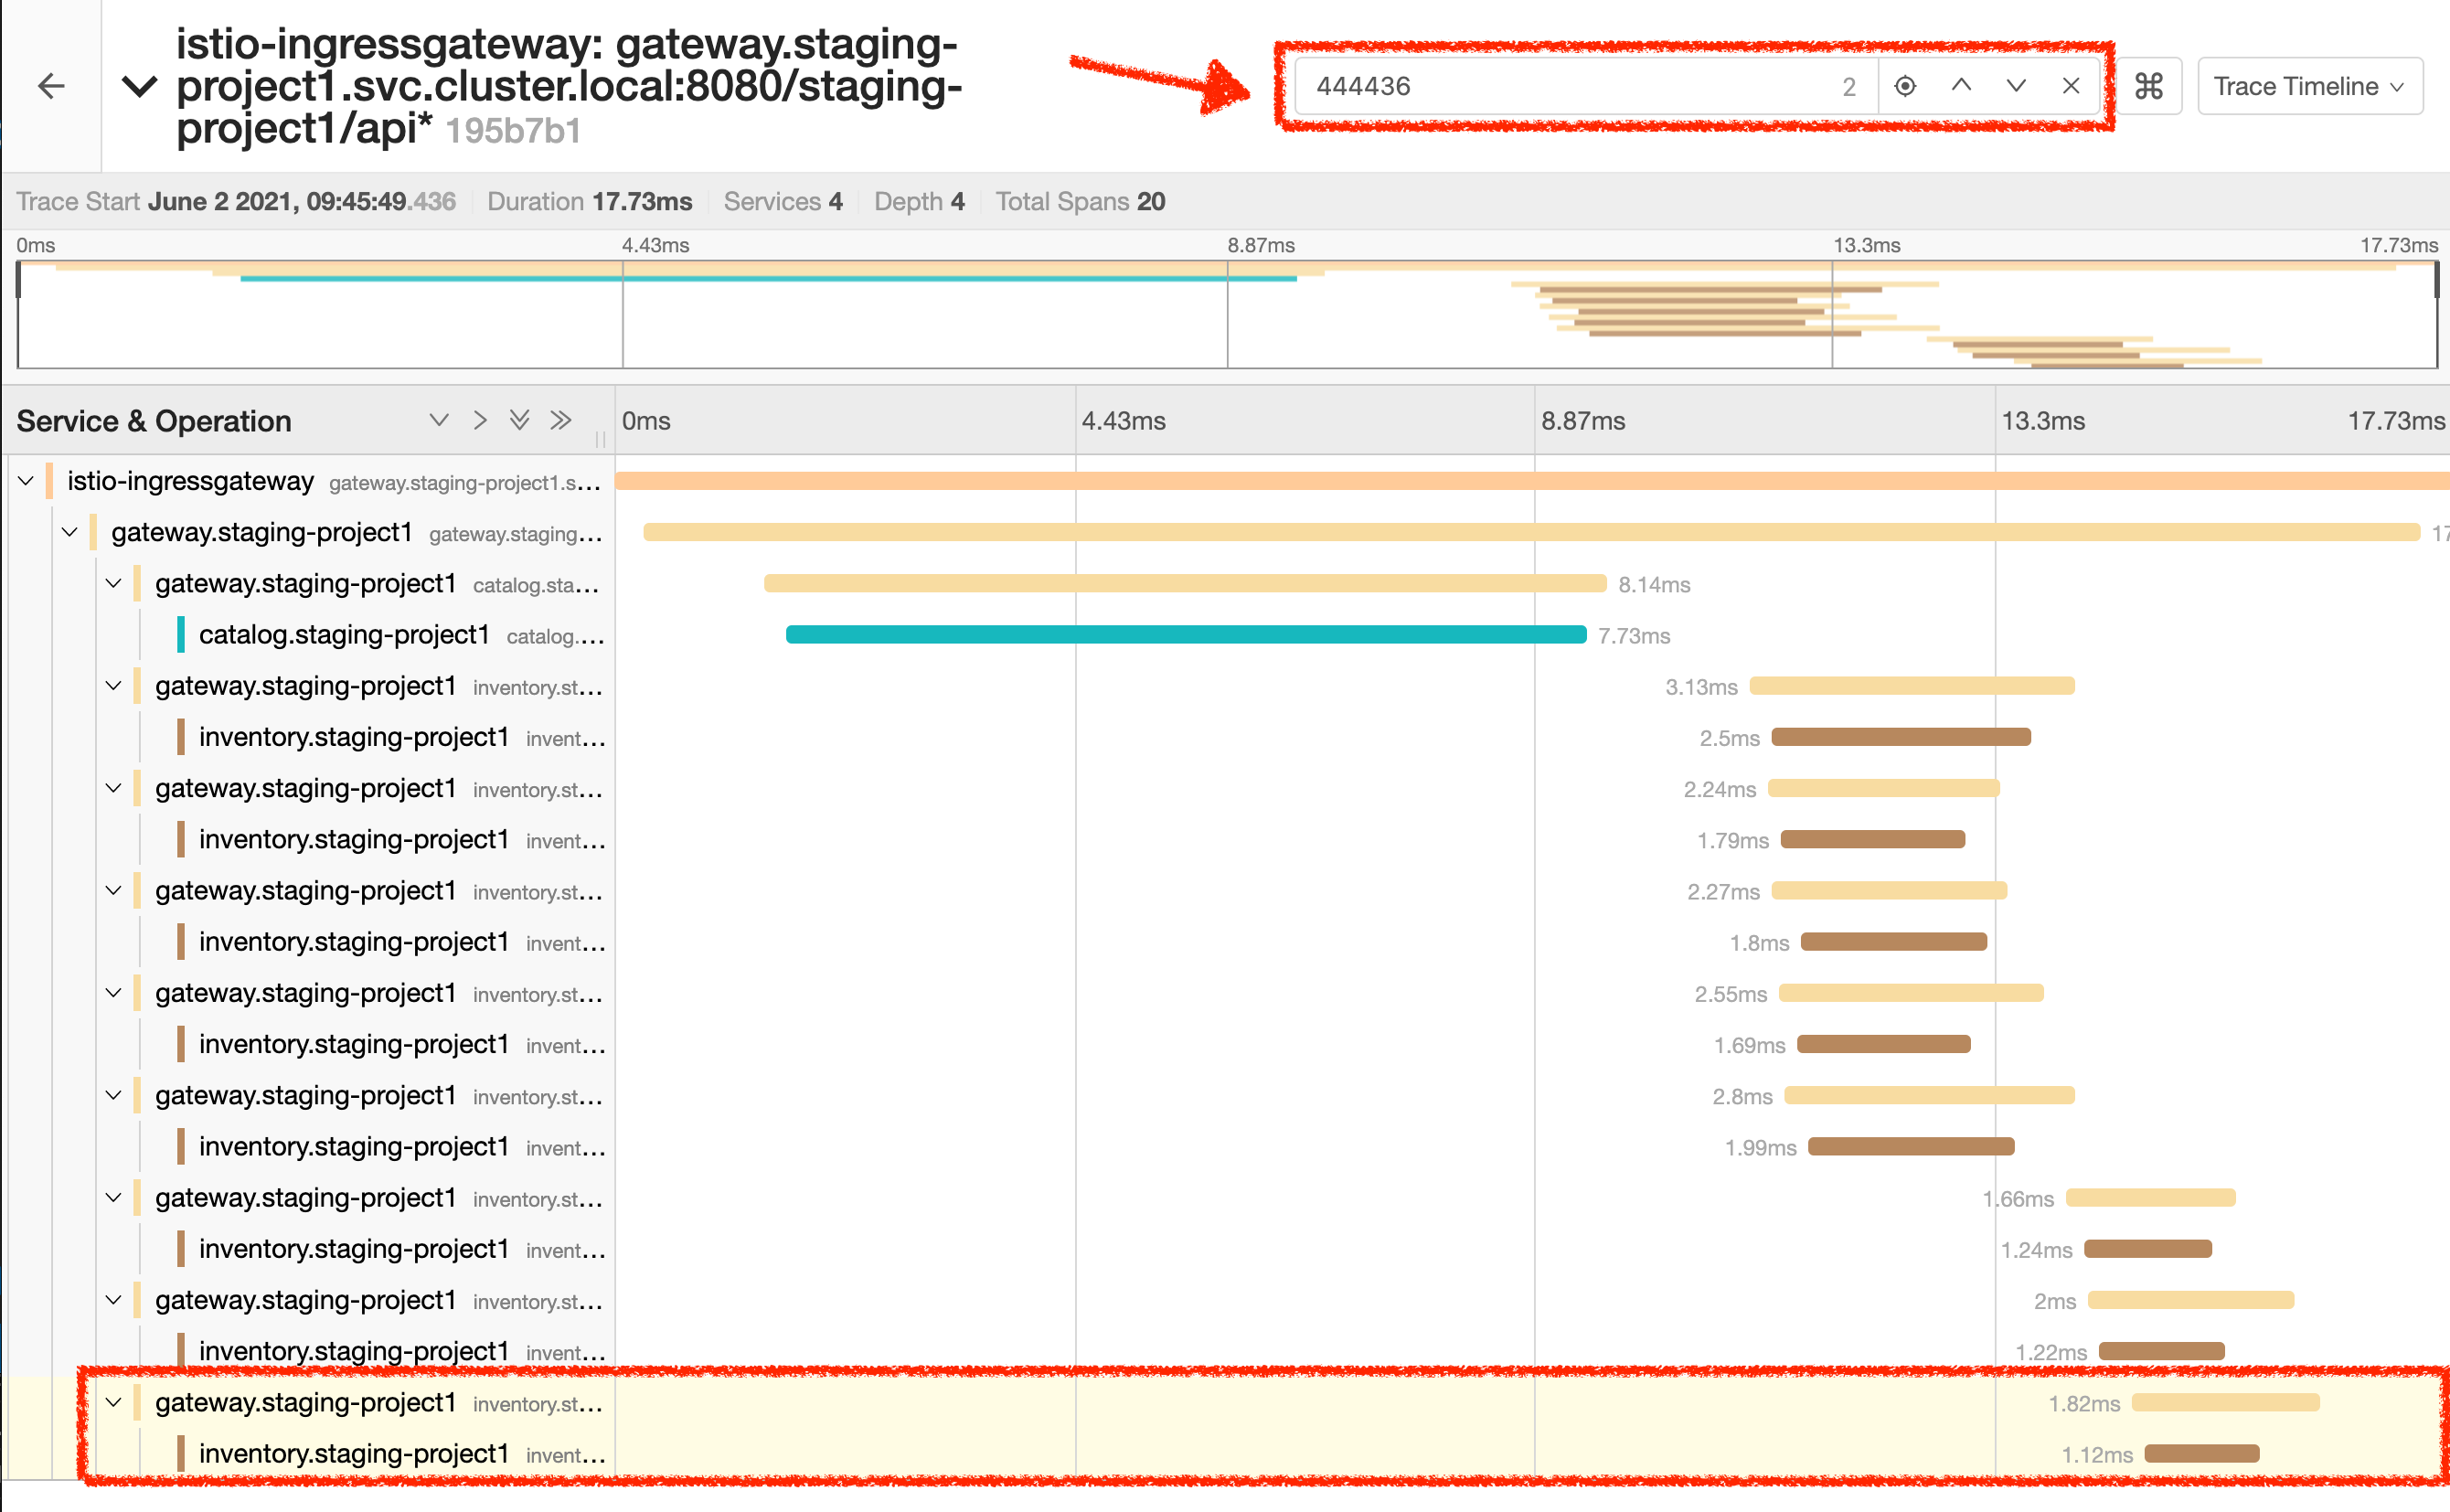
Expand the 'inventory.staging-project%USER_ID%' span in order to get more detail.
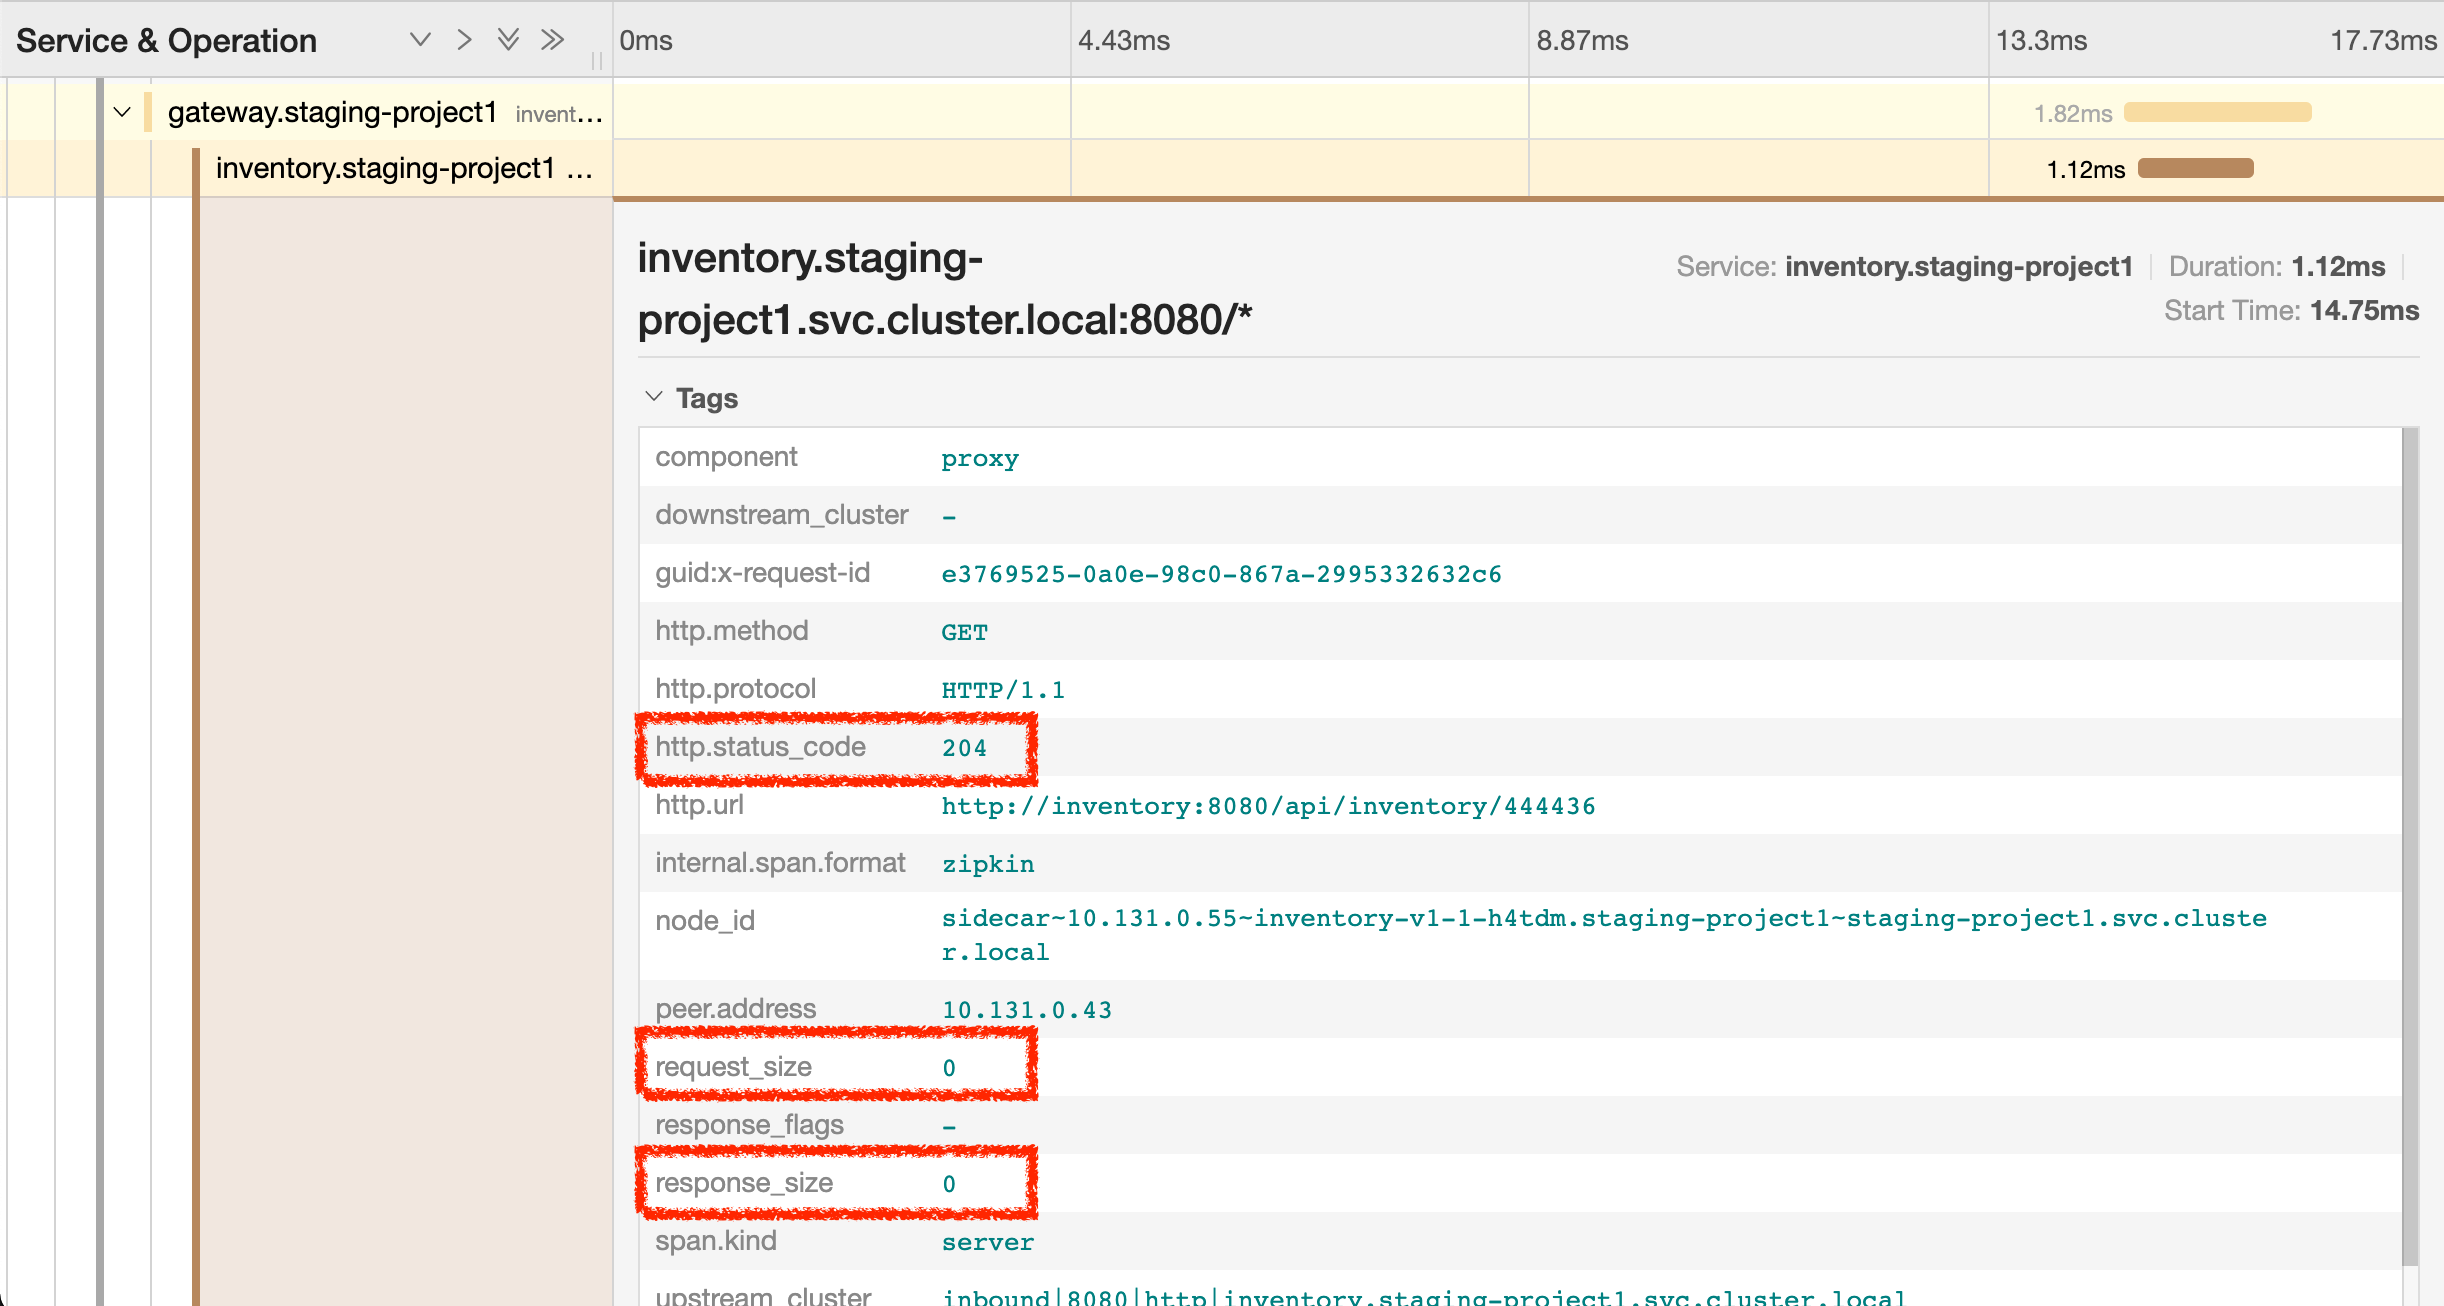
No response came back from Inventory Service for the product id 444436 and that seems to be the reason the inventory status is not displayed.
Let’s debug the Inventory Service to get to the bottom of this!
Debugging with CodeReady Workspaces and Istio Workspace
Similarly to previous lab, we will leverage Istio Workspace tool to start Inventory Service, connect to actual production cluster and debug the code.
First, we have to start Quarkus-based Inventory Service in the Dev mode. This is achieved by quarkus:dev Maven goal. This will allow us to:
-
attach the debugger to running service.
-
reload code without restarts.
We will also set header to live_debug, so we can reach our instance and debug it where all the other users will still rely on the production instance.
Having debugger attached to the production instance will result in halting the whole system for every user. We definitely don’t want this to happen. That’s why Istio Workspace was born.
|
In your Workspace,
Click on 'Terminal' → 'Run Task…' → 'Inventory - Route Traffic to local'
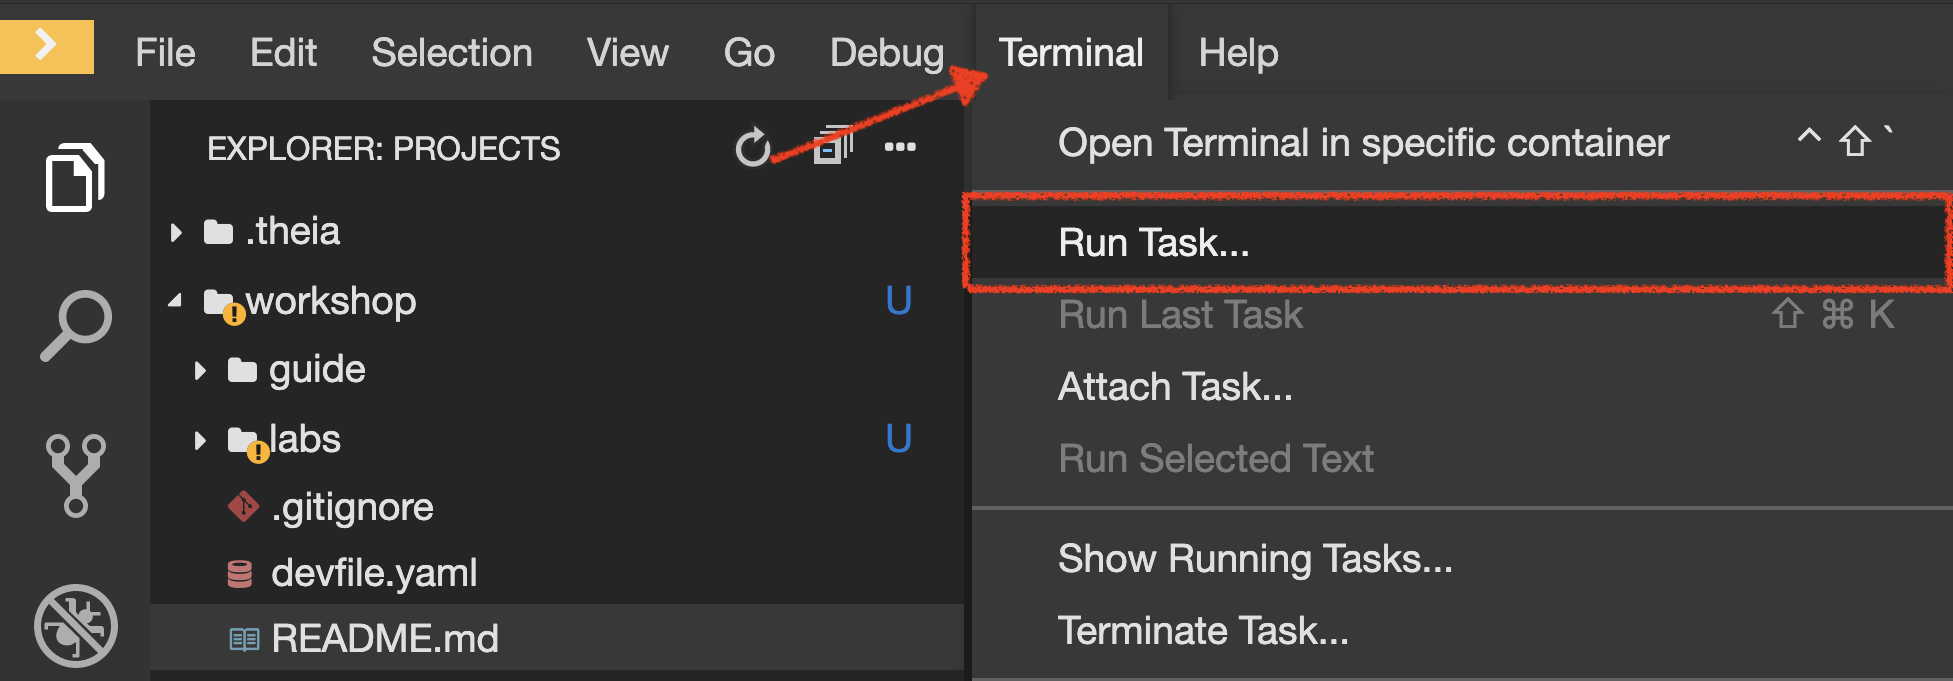
Execute the following commands in the '>_ workshop_tools' terminal window
To open a '>_ workshop_tools' terminal window, click on 'Terminal' → 'Open Terminal in specific container' → 'workshop-tools'
|
cd /projects/workshop/inventory-quarkus
ike develop \
    --deployment inventory-v1 \
    --run 'mvn compile quarkus:dev' \
    --port 8080:8080 \
    --route header:ike-session-id=live_debug
you kill all current ike process with the command: pkill ike
|
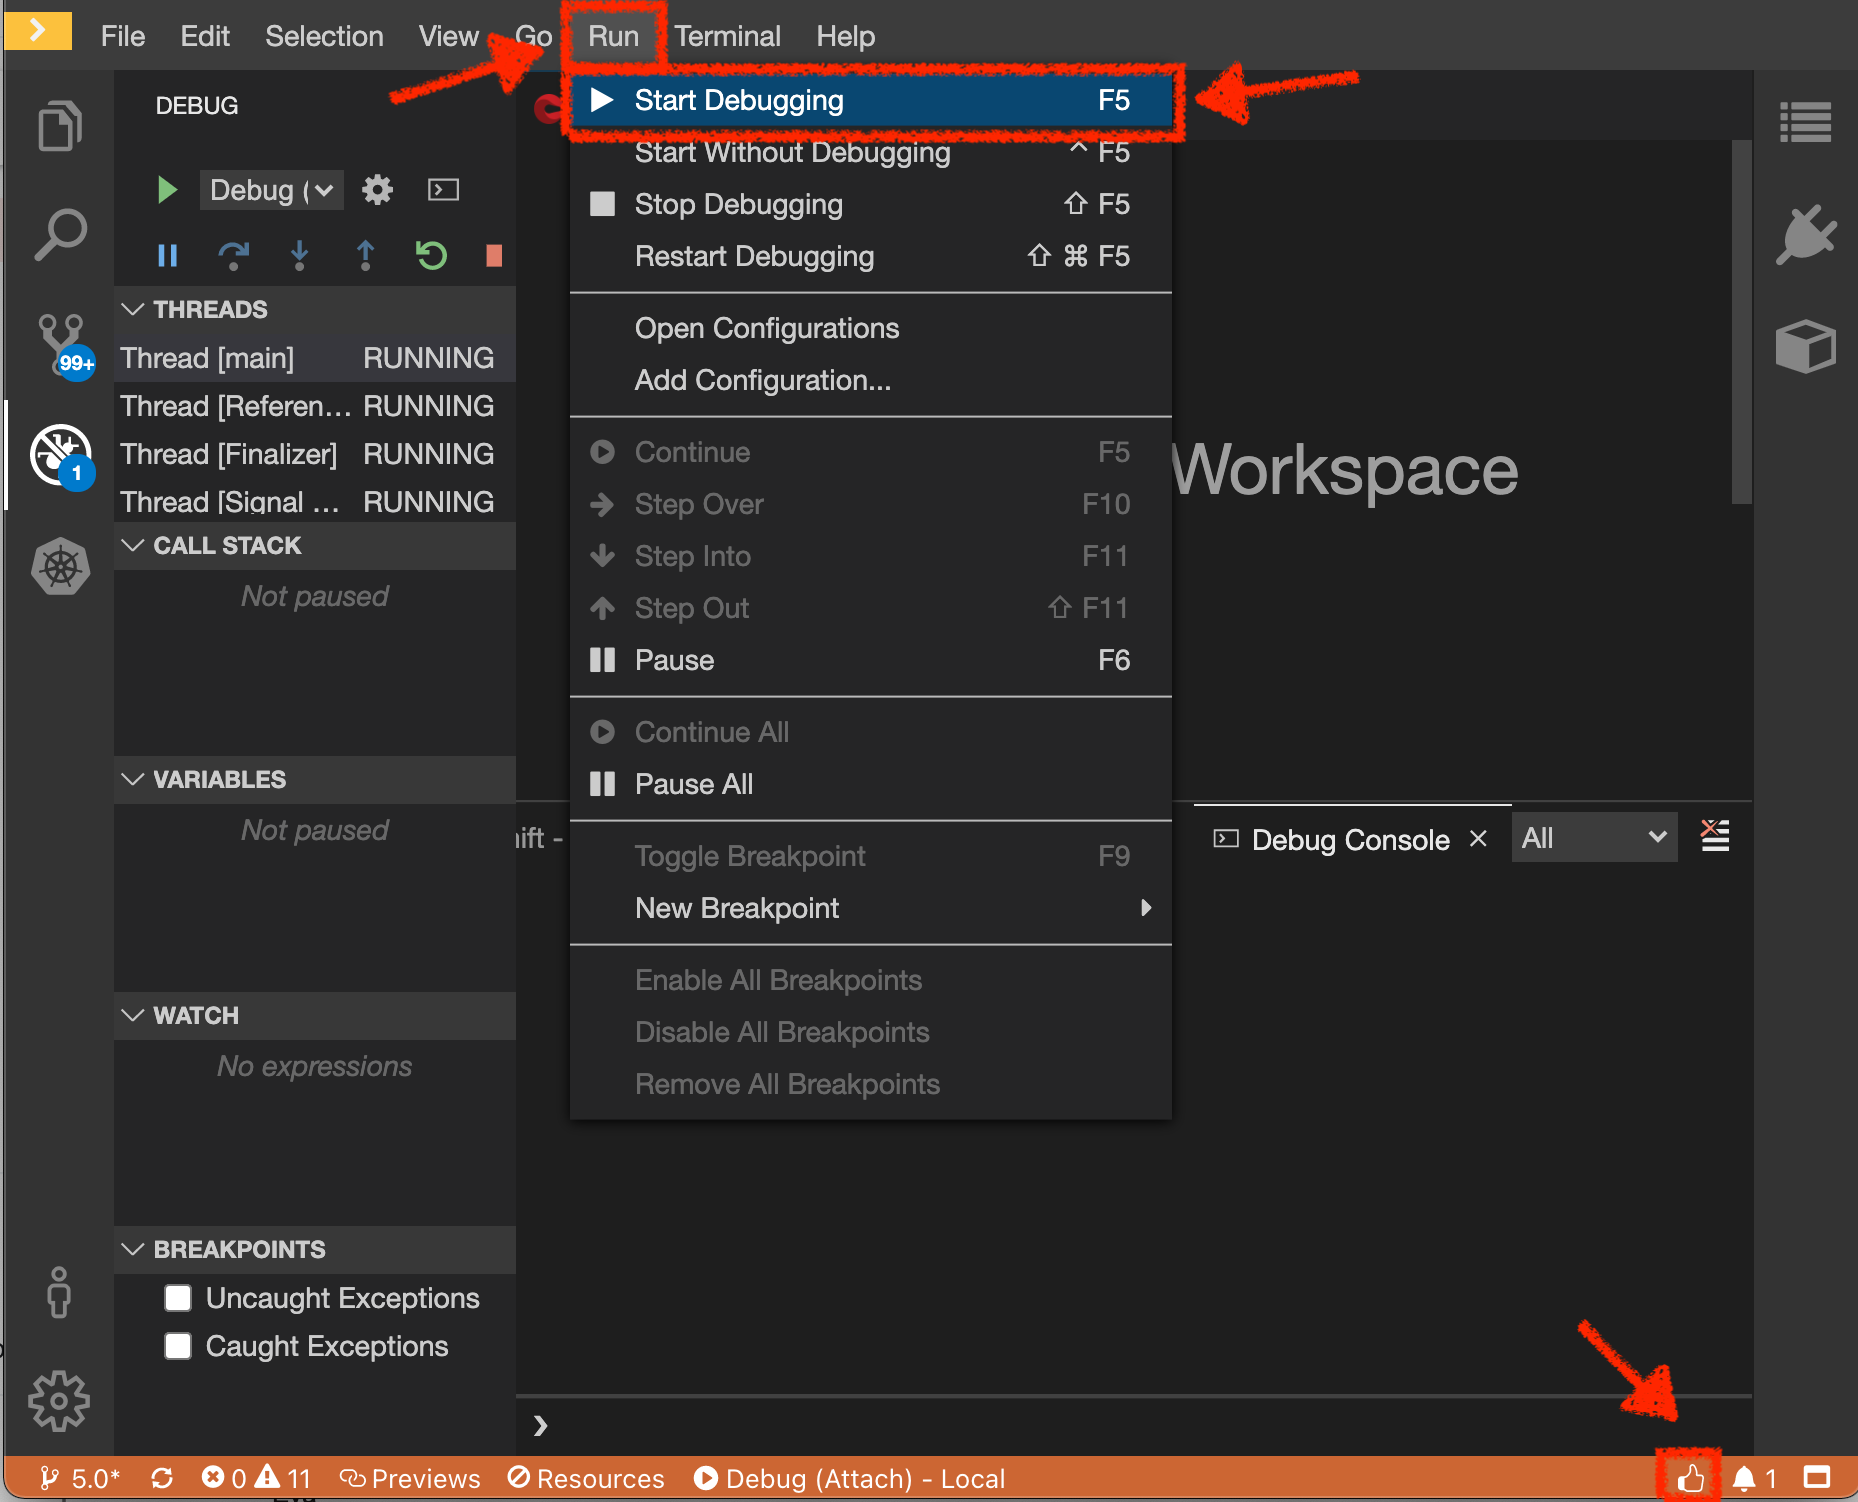
Next, you start debugging by clicking on Run → Start Debugging
|
The debugger works with Language Support for Java™ by Red Hat (the language server) for source mapping and project support. Ensure the language server is loaded correctly by checking the 👍 icon at the right side of the status bar. |
In your Workspace,
open the 'Explorer' view in the left menu and edit the 'com.redhat.cloudnative.inventory.InventoryResource' class
in the 'inventory-quarkus' project
.
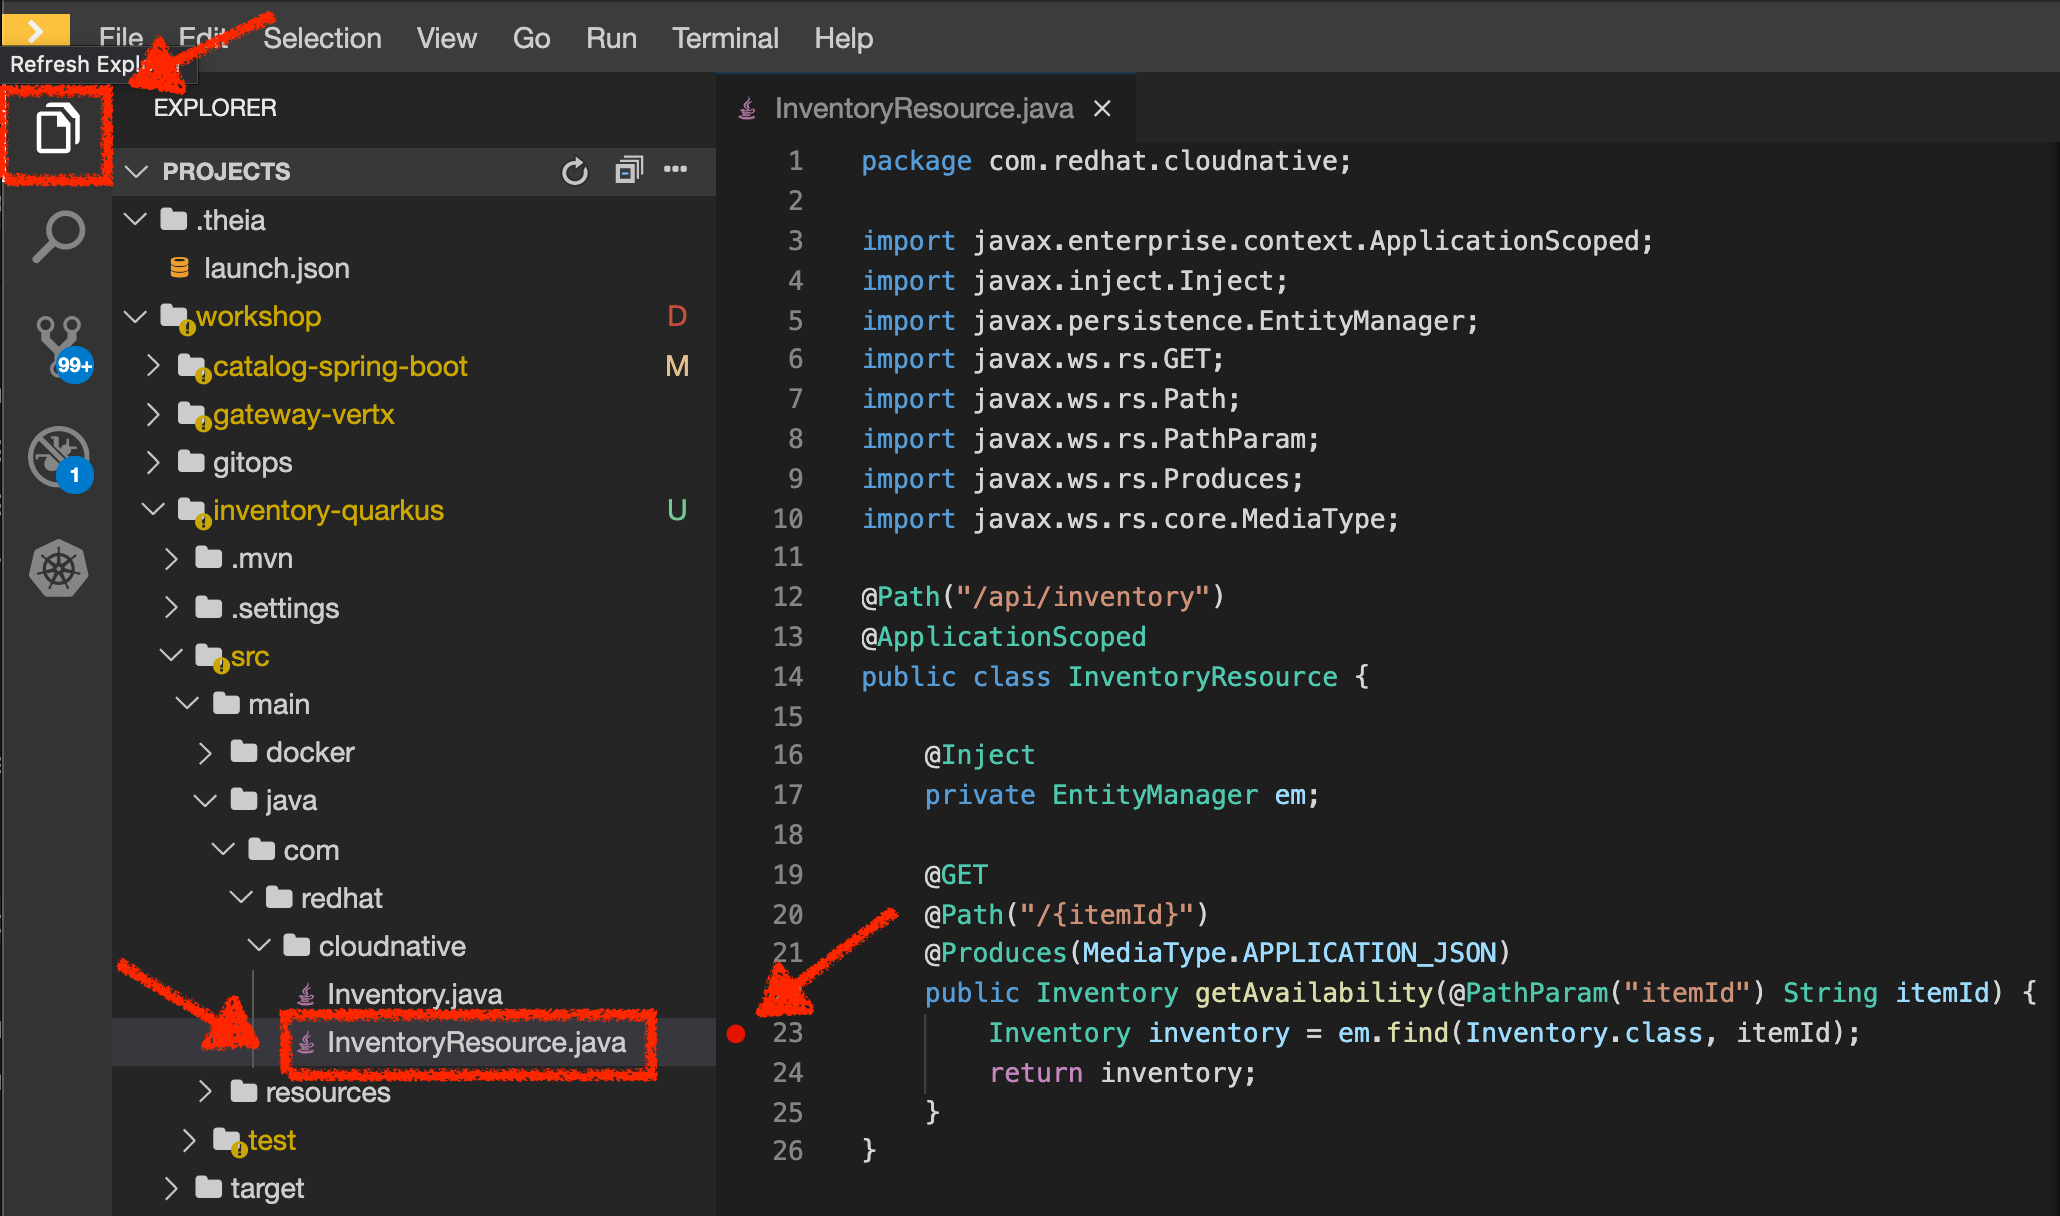
Add a breakpoint by clicking on the editor sidebar on the line number of the first line of the 'getAvailability()'
method
.
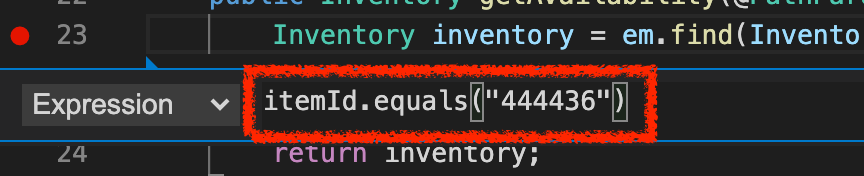
Additionally, we can narrow breakpoint capture by enabling a condition itemId.equals("444436").
Right-click on the breakpoint and select 'Edit Breakpoint…' option.
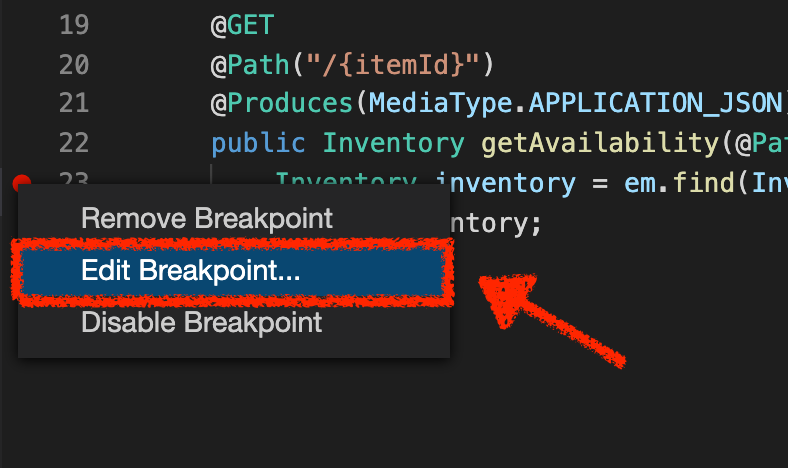
Then add expression mentioned above - itemId.equals("444436") - and hit 'ENTER'.
We can now access the Coolstore application with the new route to see if we can reach the breakpoint.
http://web-staging-project%USER_ID%.%APPS_HOSTNAME_SUFFIX%/#!/?route=live_debugThe IDE will automatically switch back to the Debug Panel and notice that the code execution is paused at the breakpoint on InventoryResource class.
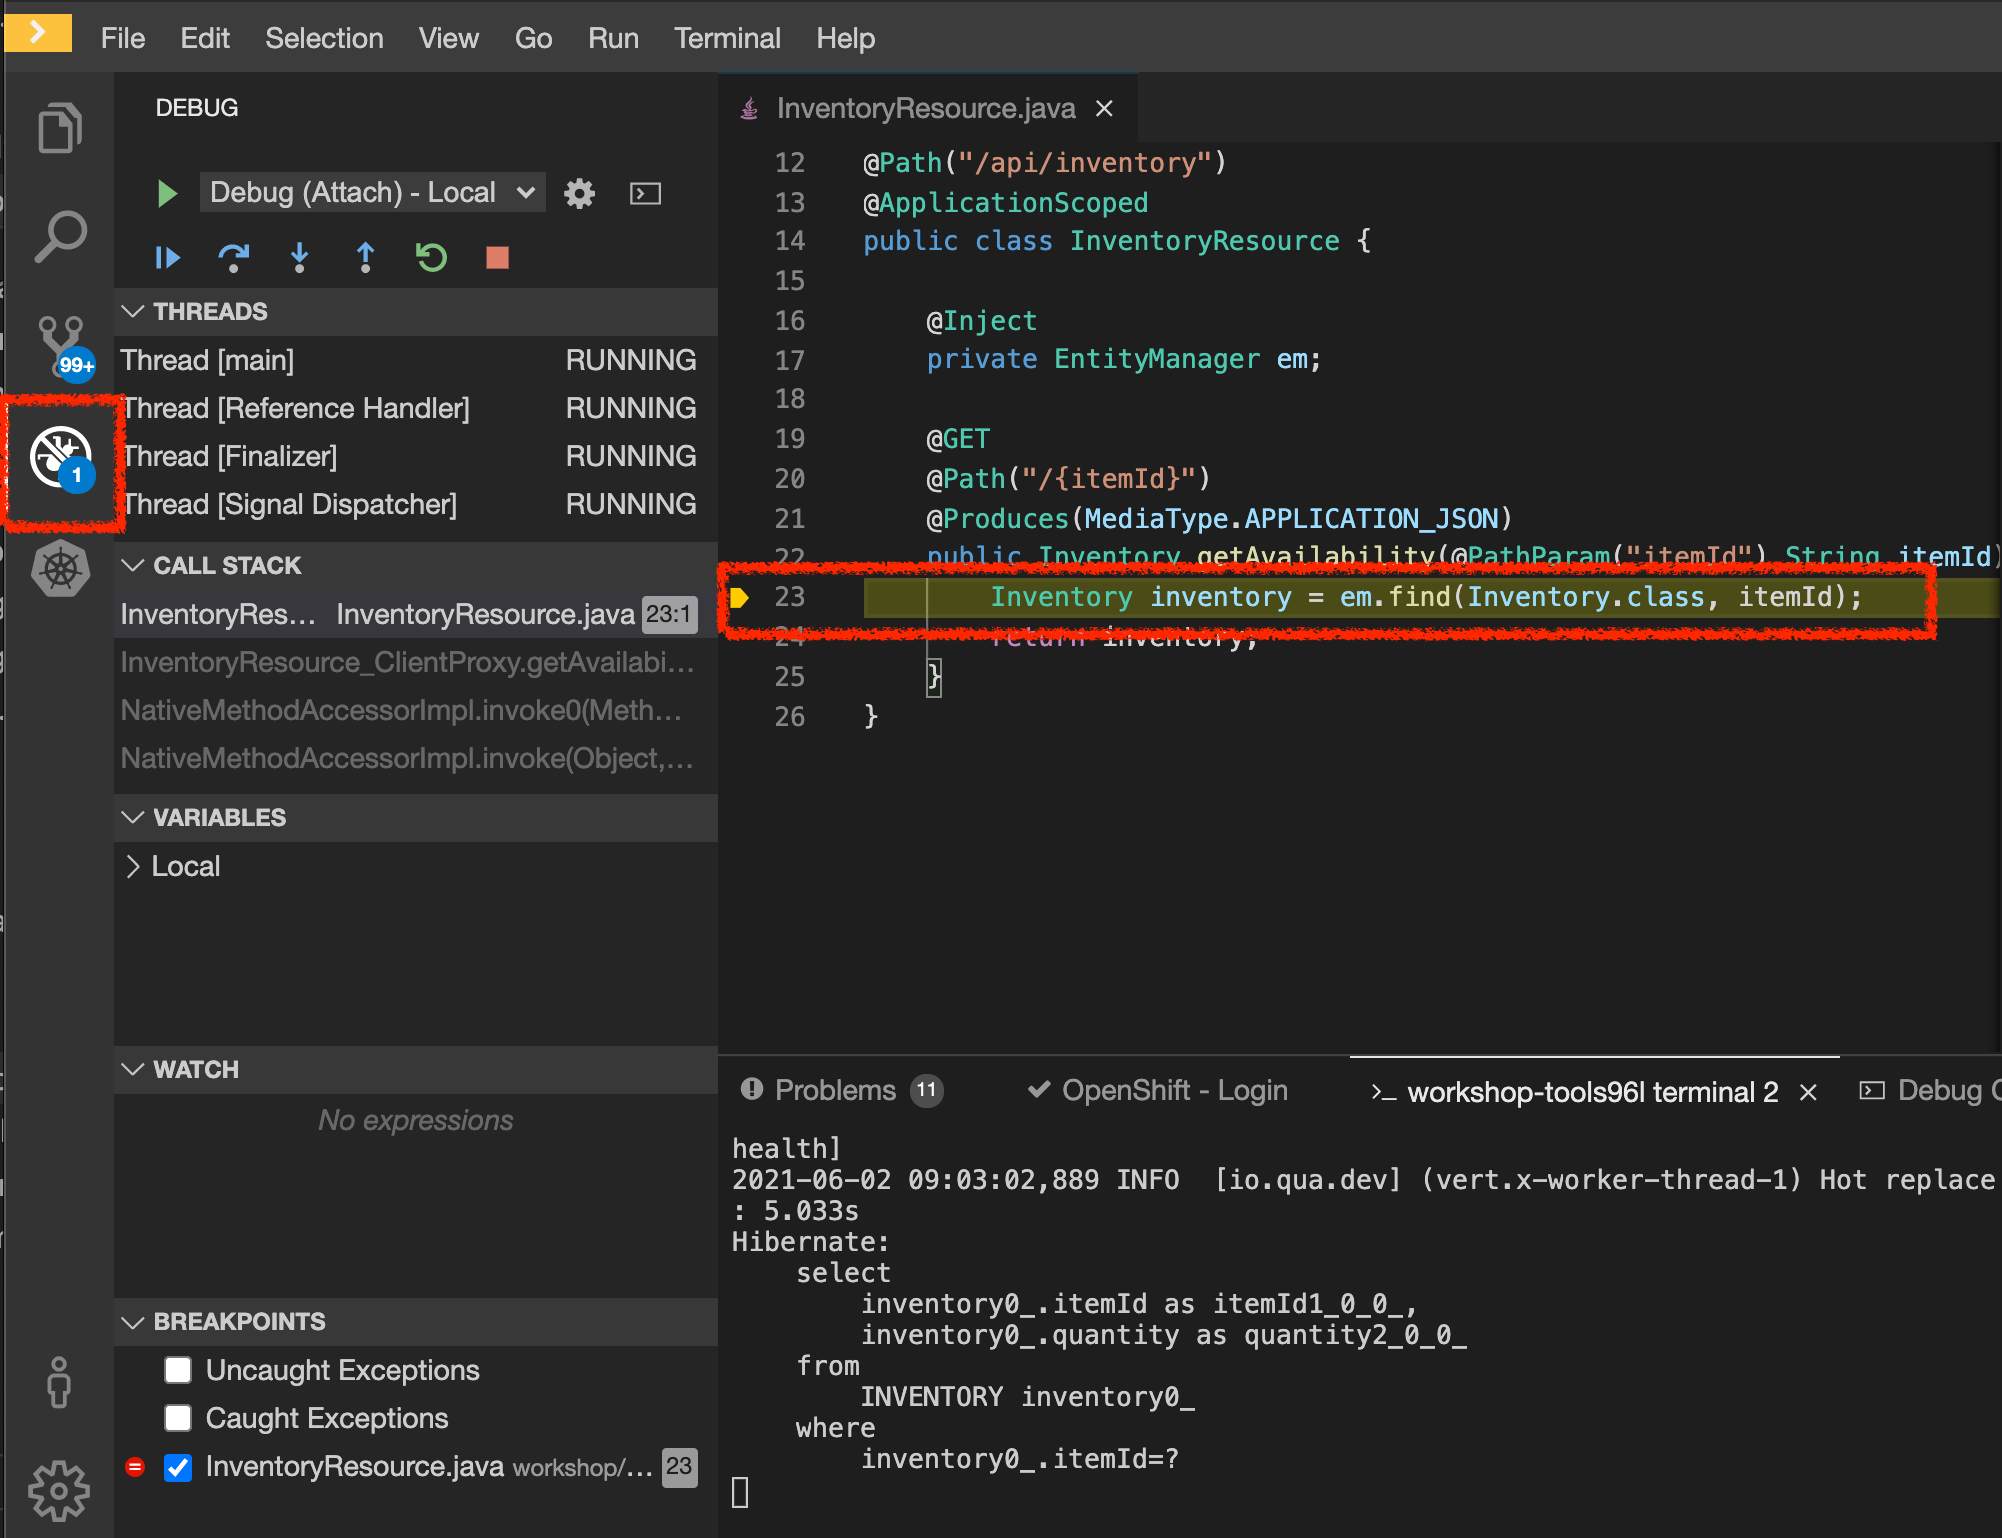
Click on the Step Over icon to execute one line and retrieve the inventory object for the
given product id from the database.
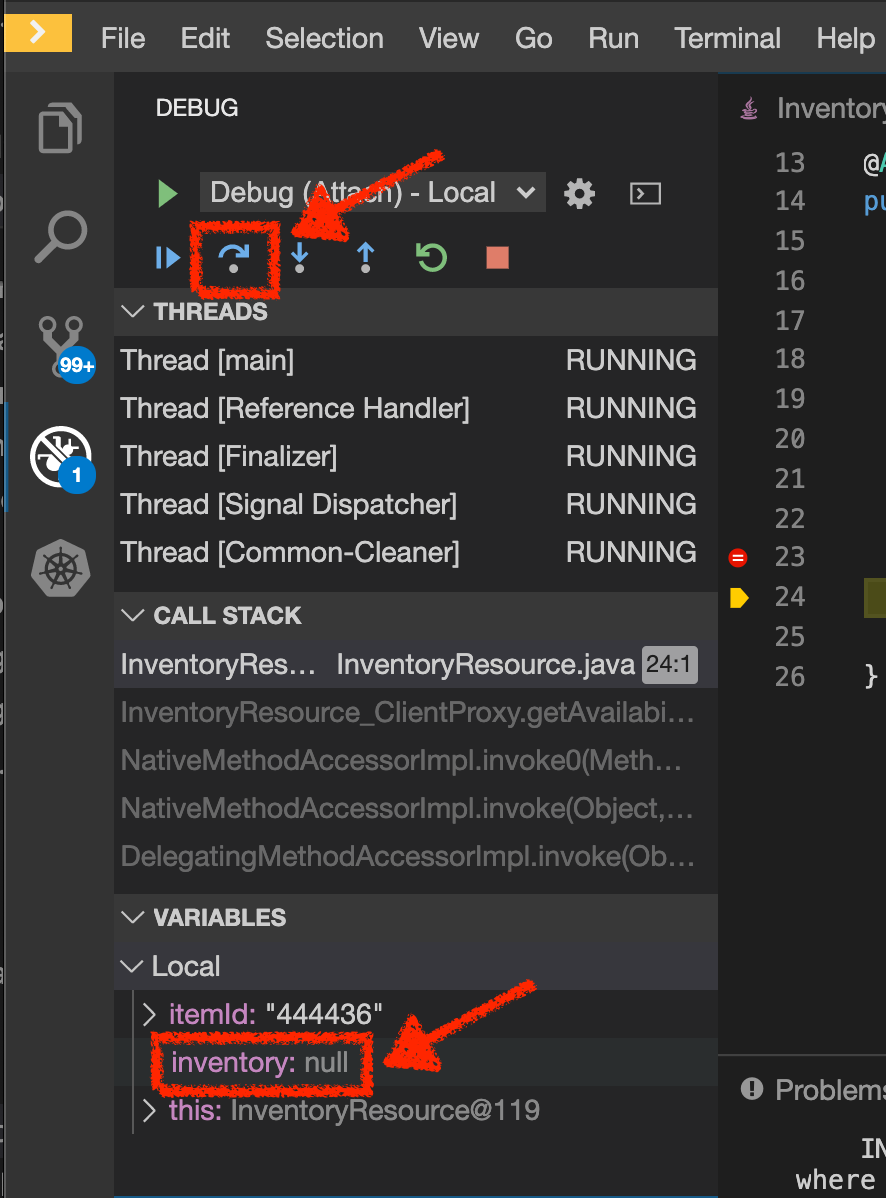
Can you spot the bug now?
Look at the 'Variables' window on the left-hand side. The retrieved inventory object is null!
The non-existing product id is not a problem on its own. It simply could mean this product is discontinued and removed from the Inventory database, but it’s not removed from the product catalog database yet. However, the bug occurs because the code returns null value instead of a sensible REST response. If the product id does not exist, a proper JSON response stating a zero inventory should be returned instead of null.
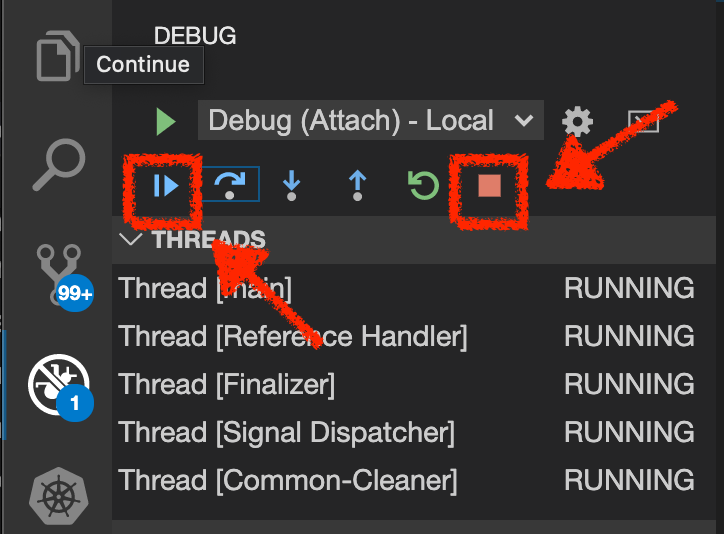
Click on the 'Resume' icon then on the 'Stop' icon to end the debugging session.
Fix the Bug
In your Workspace, under the inventory-quarkus project,
update the getAvailability() method of the InventoryResource class as follows:
@GET
@Path("/{itemId}")
@Produces(MediaType.APPLICATION_JSON)
public Inventory getAvailability(@PathParam("itemId") String itemId) {
    Inventory inventory = em.find(Inventory.class, itemId);

    if (inventory == null) { (1)
        inventory = new Inventory();
        inventory.setItemId(itemId);
        inventory.setQuantity(0);
    }

    return inventory;
}| 1 | handles the 'null' value for the inventory entity |
After changing the code, please access the Coolstore application with the 'route=live_debug' header and
to verify how it works now.
http://web-staging-project%USER_ID%.%APPS_HOSTNAME_SUFFIX%/#!/?route=live_debug
If it looks ok we are ready to roll it out to production!
You can now stop the "Inventory - Route Traffic to Local" (ike) process in the terminal by pressing Ctrl+C. This will result in undeploying our special instance which we just used for debugging purposes.
Well done and congratulations for completing all the labs.