Connect and Monitor your Application with OpenShift Service Mesh
45 MINUTE EXERCISE
In this lab you will enable tracing and monitoring of your backend services using Service Mesh.
The term Service Mesh describes the network of microservices that make up applications in a distributed microservice architecture and the interactions between those microservices. As a service mesh grows in size and complexity, it can become harder to understand and manage.
Red Hat OpenShift Service Mesh is a platform that provides behavioral insight and operational control over the Service Mesh, providing a uniform way to connect, secure, and monitor microservice applications.
Based on the open source Istio project, Red Hat OpenShift Service Mesh adds a transparent layer on existing distributed applications without requiring any changes to the service code. You add Red Hat OpenShift Service Mesh support to services by deploying a special sidecar proxy throughout your environment that intercepts all network communication between microservices. You configure and manage the service mesh using the control plane features.
Red Hat OpenShift Service Mesh provides an easy way to create a network of deployed services that provides discovery, load balancing, service-to-service authentication, failure recovery, metrics, and monitoring. A service mesh also provides more complex operational functionality, including A/B testing, canary releases, rate limiting, access control, and end-to-end authentication.
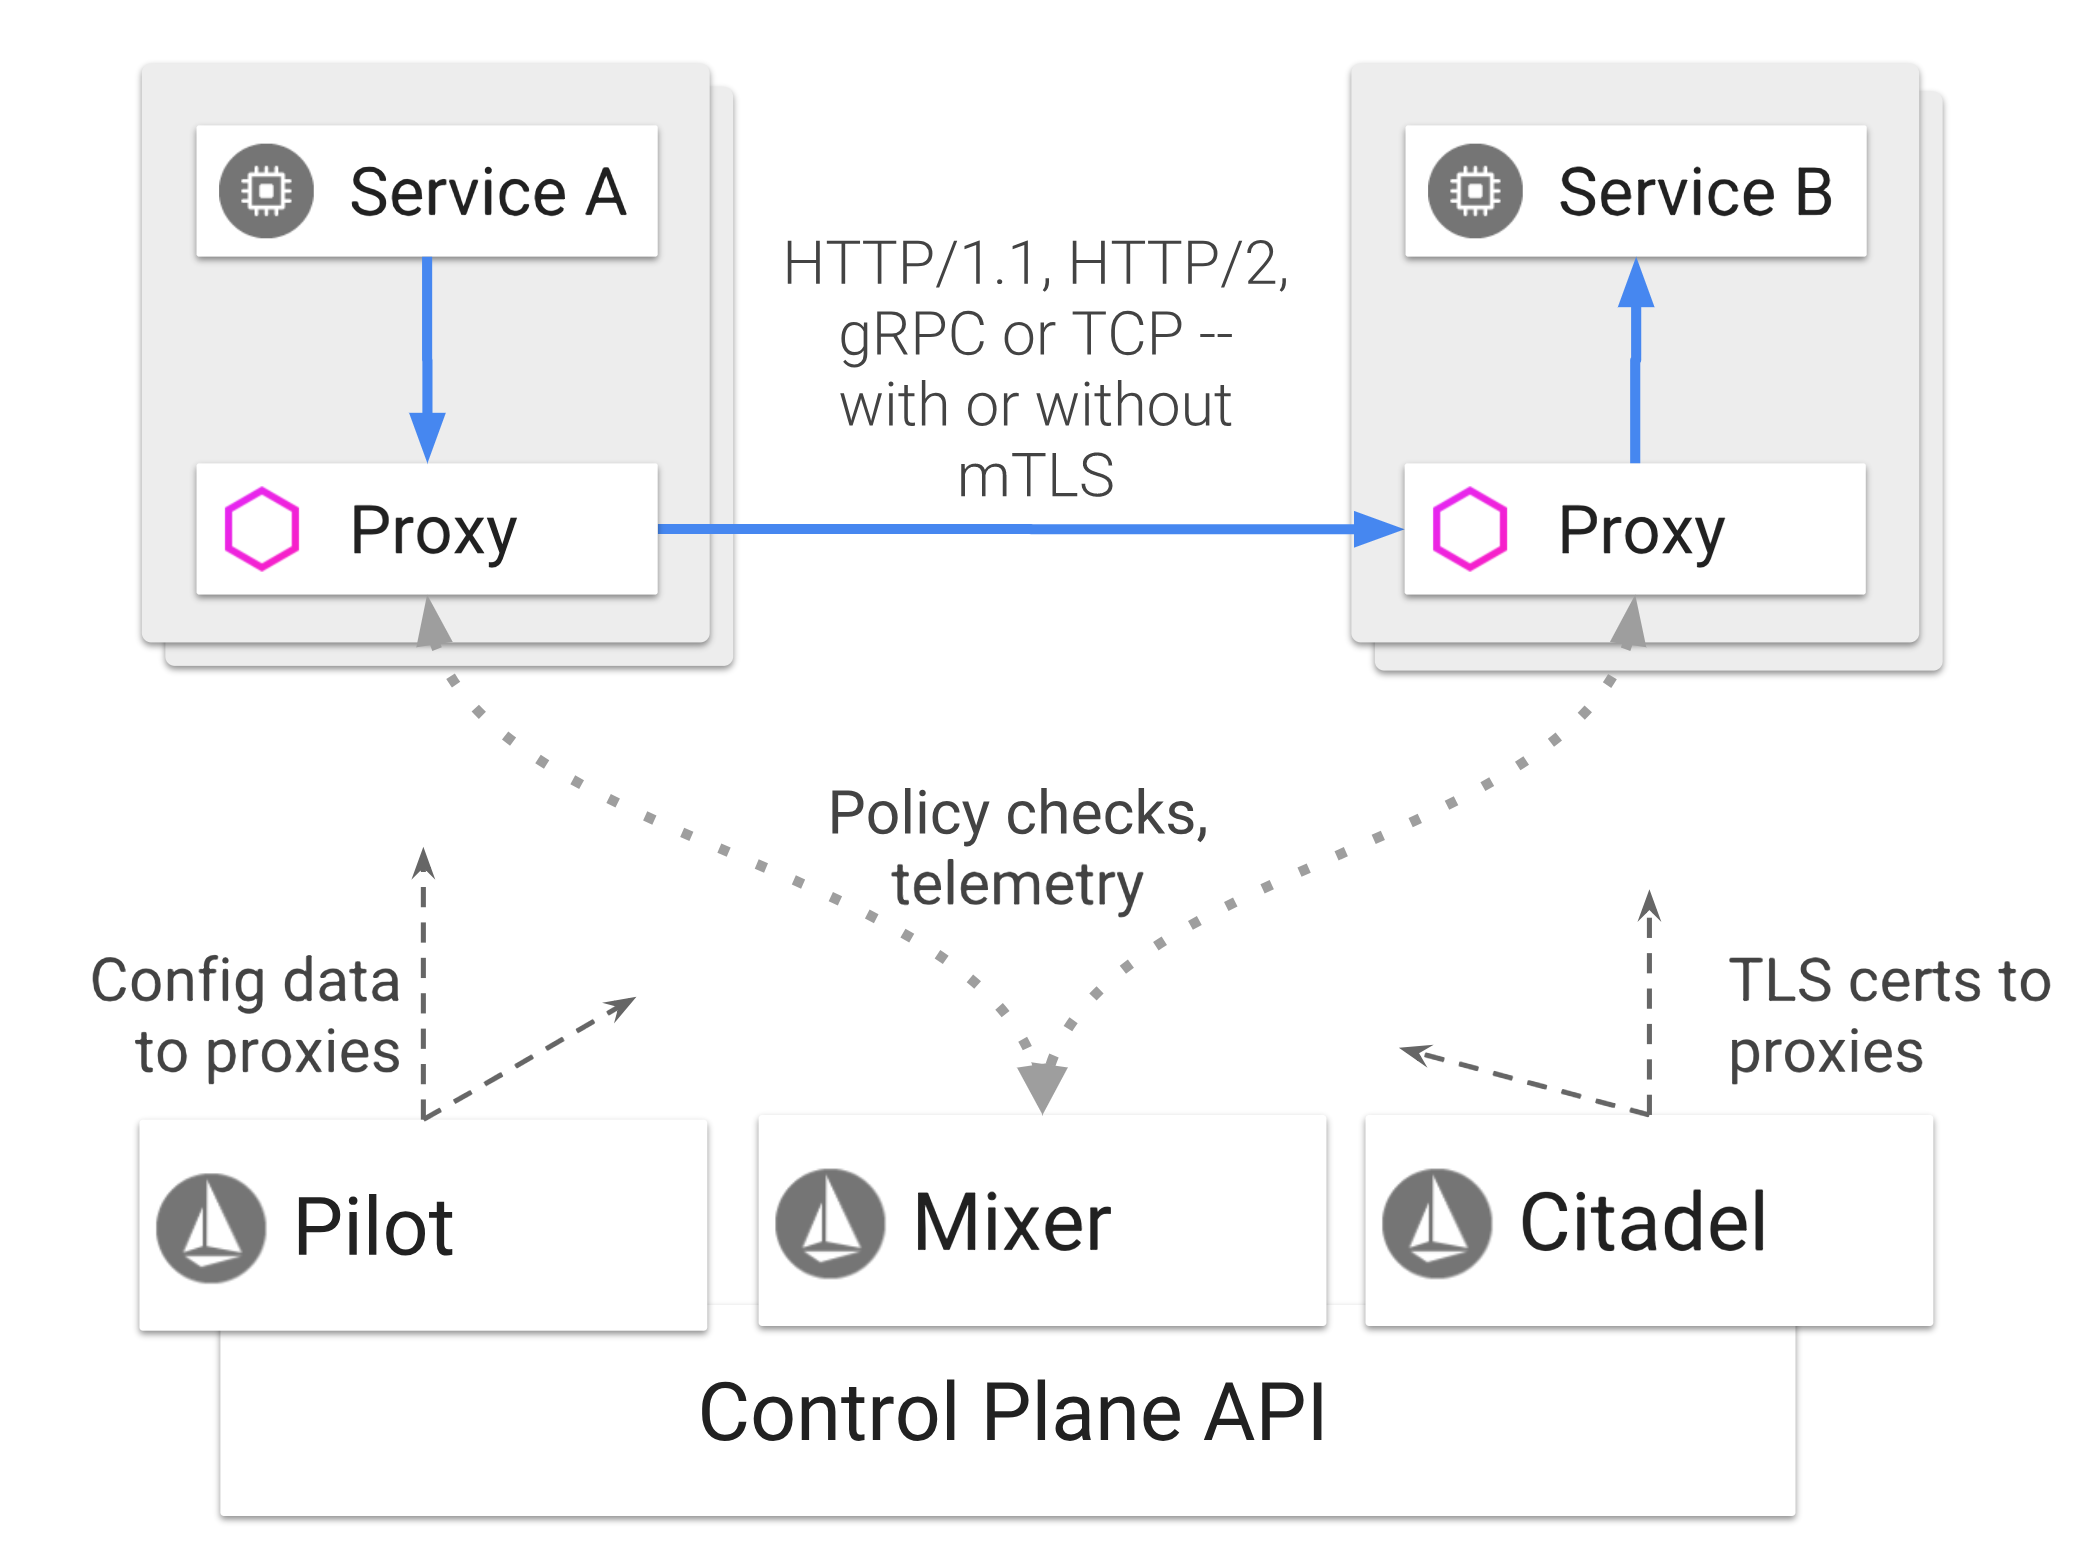
Red Hat OpenShift Service Mesh is logically split into a data plane and a control plane:
-
The data plane is composed of a set of intelligent proxies deployed as sidecars. These proxies intercept and control all inbound and outbound network communication between microservices in the service mesh; sidecar proxies also communicate with Mixer, the general-purpose policy and telemetry hub.
-
The control plane is responsible for managing and configuring proxies to route traffic, and configuring Mixers to enforce policies and collect telemetry.
The components that make up the data plane and the control plane are:
-
Envoy proxy - is the data plane component that intercepts all inbound and outbound traffic for all services in the service mesh. Envoy is deployed as a sidecar to the relevant service in the same pod.
-
Mixer - is the control plane component responsible for enforcing access control and usage policies (such as authorization, rate limits, quotas, authentication, request tracing) and collecting telemetry data from the Envoy proxy and other services.
-
Pilot - is the control plane component responsible for configuring the proxies at runtime. Pilot provides service discovery for the Envoy sidecars, traffic management capabilities for intelligent routing (for example, A/B tests or canary deployments), and resiliency (timeouts, retries, and circuit breakers).
-
Citadel - is the control plane component responsible for certificate issuance and rotation. Citadel provides strong service-to-service and end-user authentication with built-in identity and credential management. You can use Citadel to upgrade unencrypted traffic in the service mesh. Using Citadel, operators can enforce policies based on service identity rather than on network controls.
Enabling Service Mesh to Inventory Service
OpenShift Service Mesh automatically injects the sidecar into the Pod by specifying a specific annotation in the DeploymentConfig.
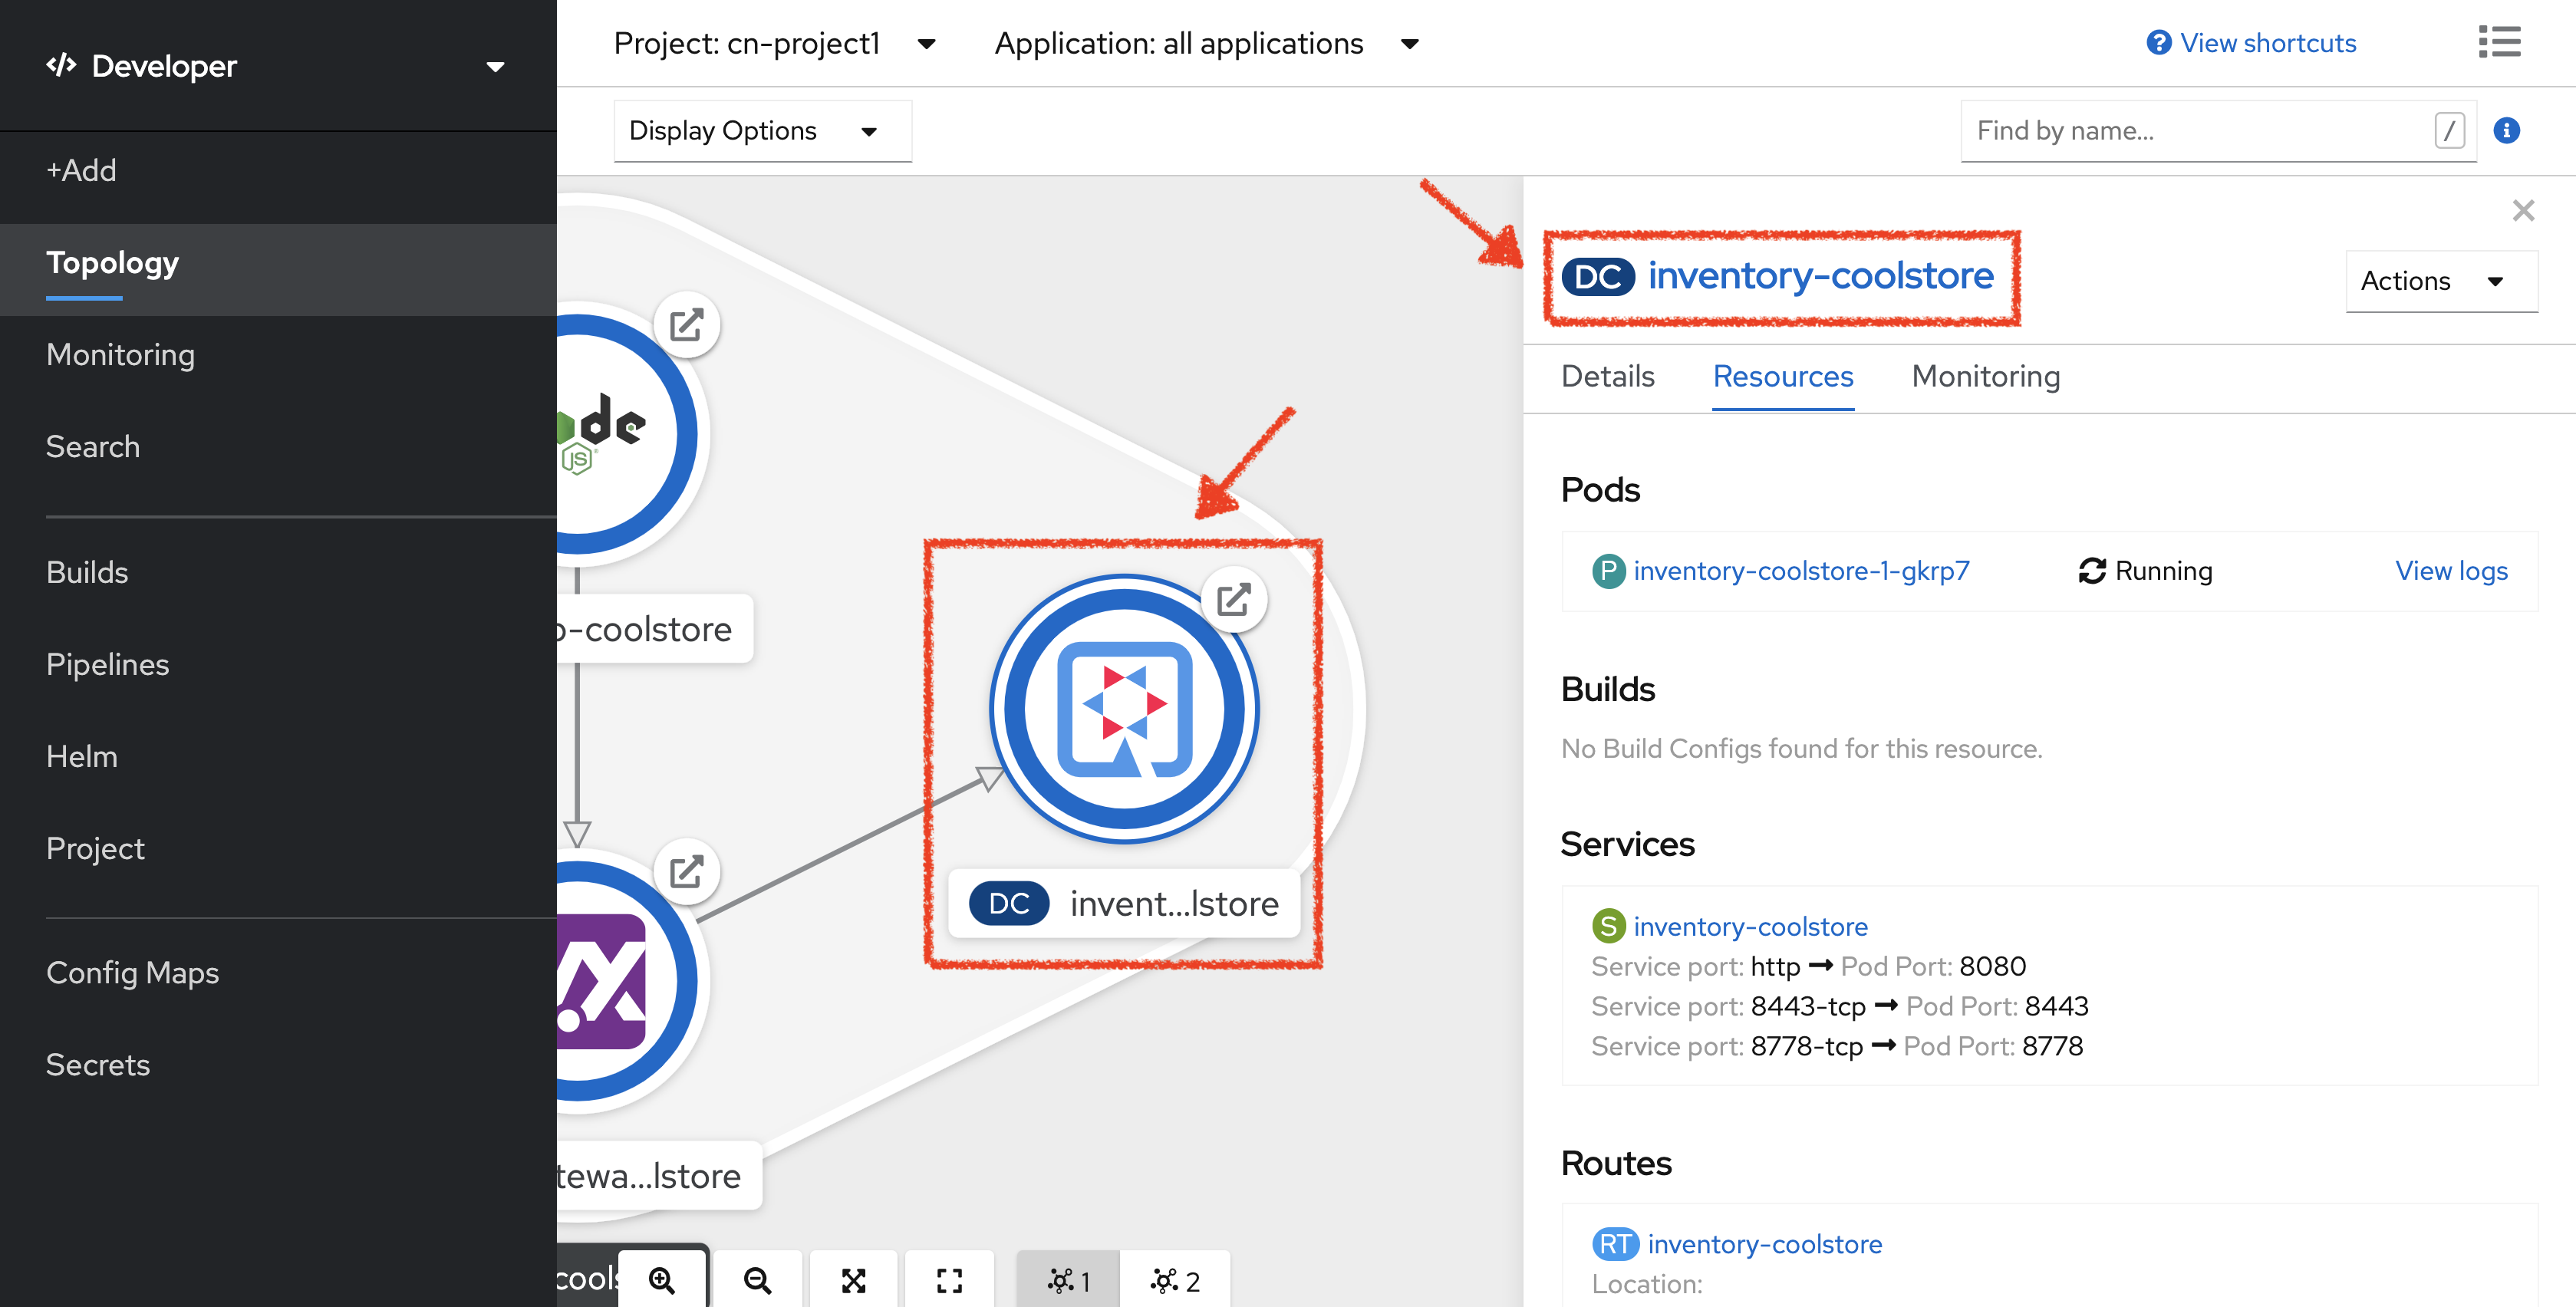
In the OpenShift Web Console, from the Developer view,
click on the 'DC inventory-coolstore' bubble → 'DC inventory-coolstore'
Then, click on the 'YAML' tab and add sidecar.istio.io/inject: 'true' under the 'spec.template.metadata.annotations' tag
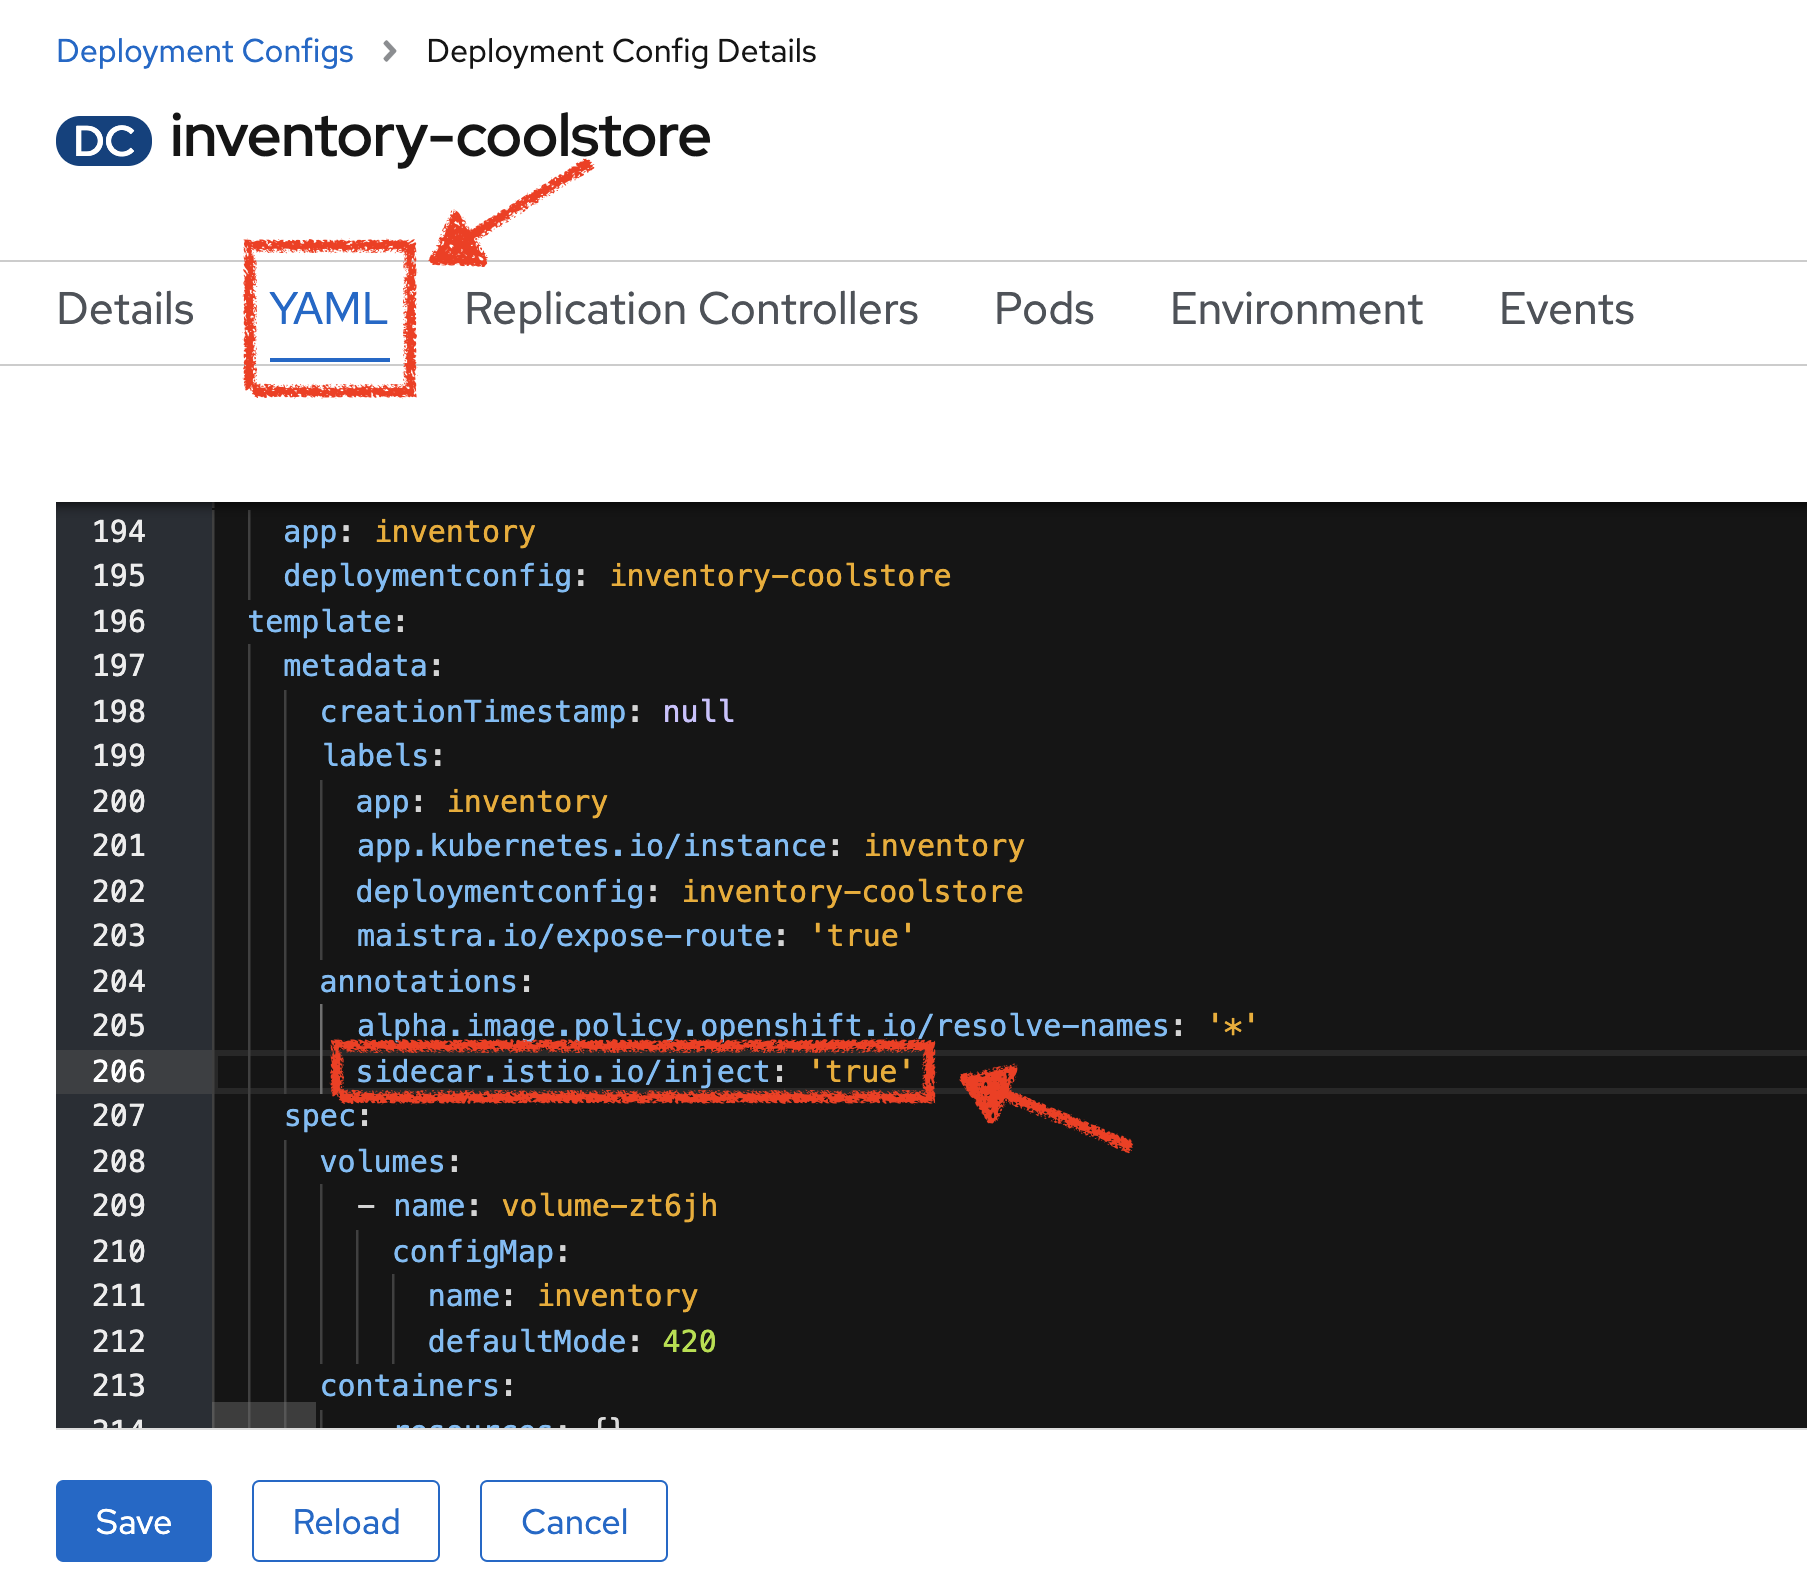
Click on the 'Save' button
Now, let’s deploy this new configuration. Click on the 'POD' tab → 'Actions' → 'Start Rollout'
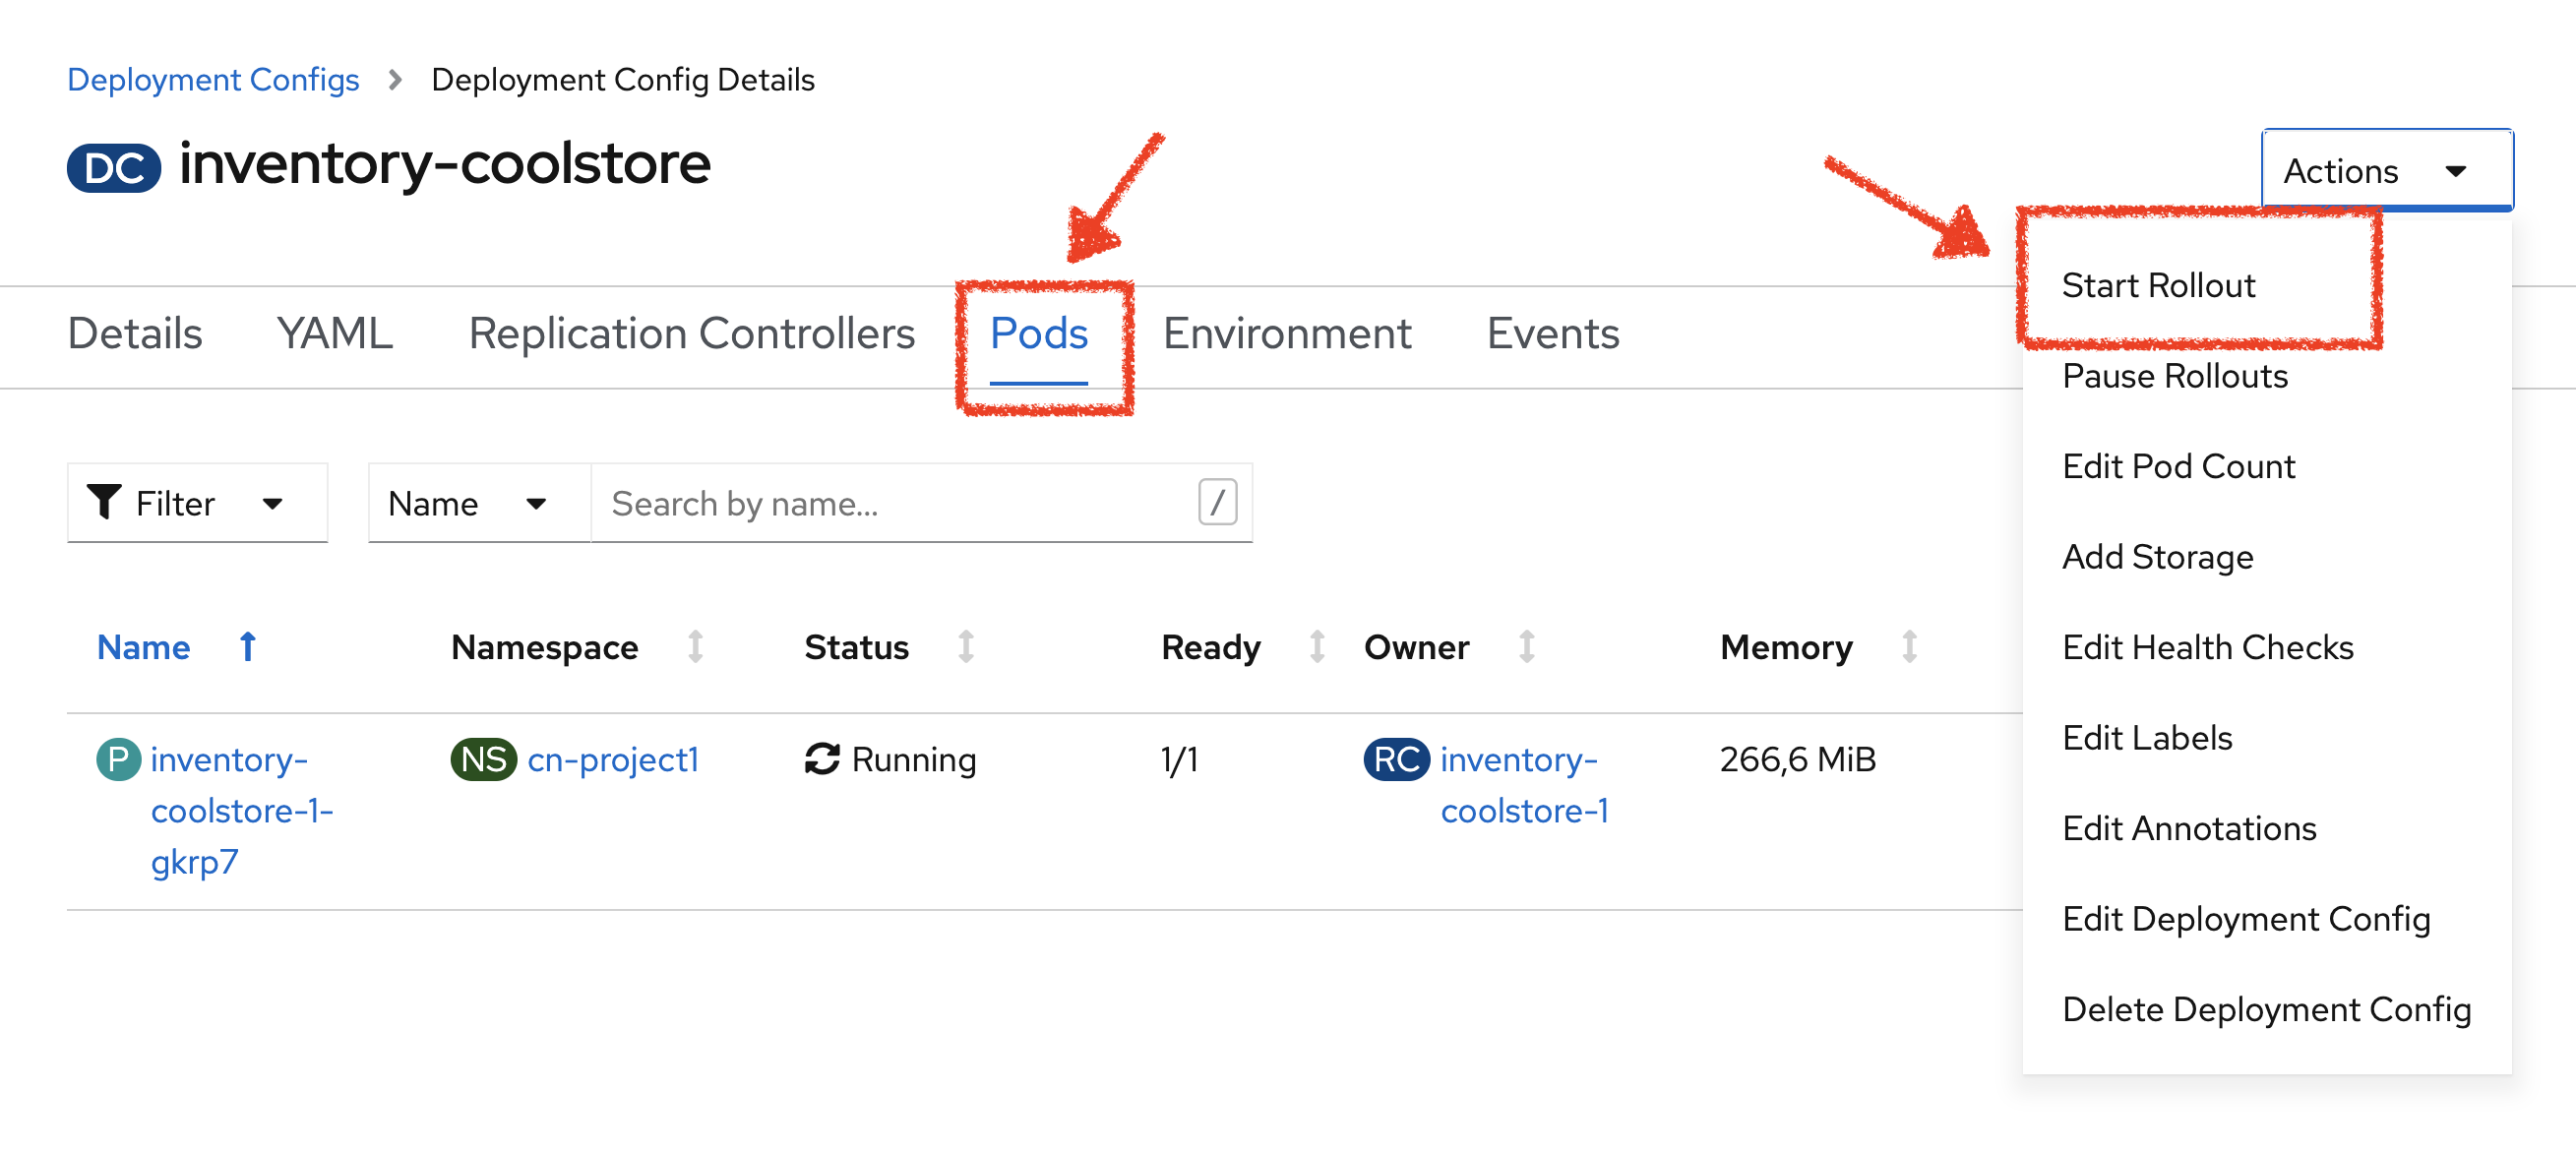
The current pod will be terminated and a new one will be deployed with 2/2 containers in the Ready column.
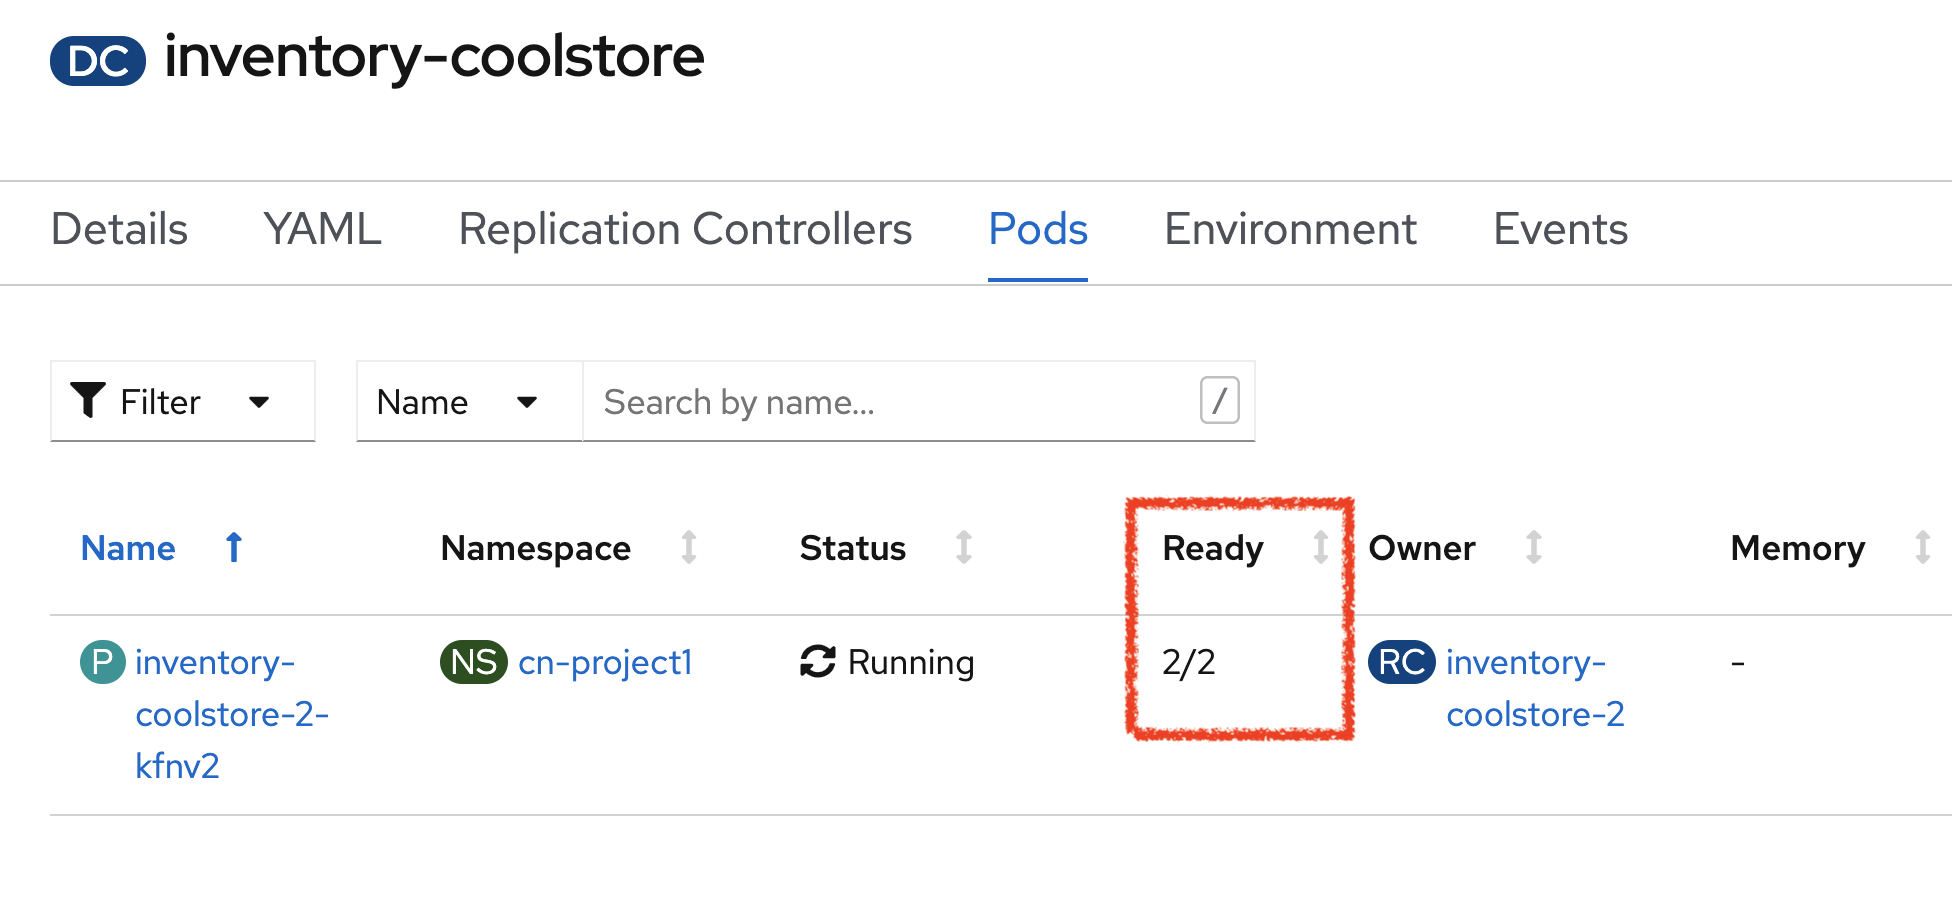
Click on 'P inventory-coolstore-xxxx' then scroll down.
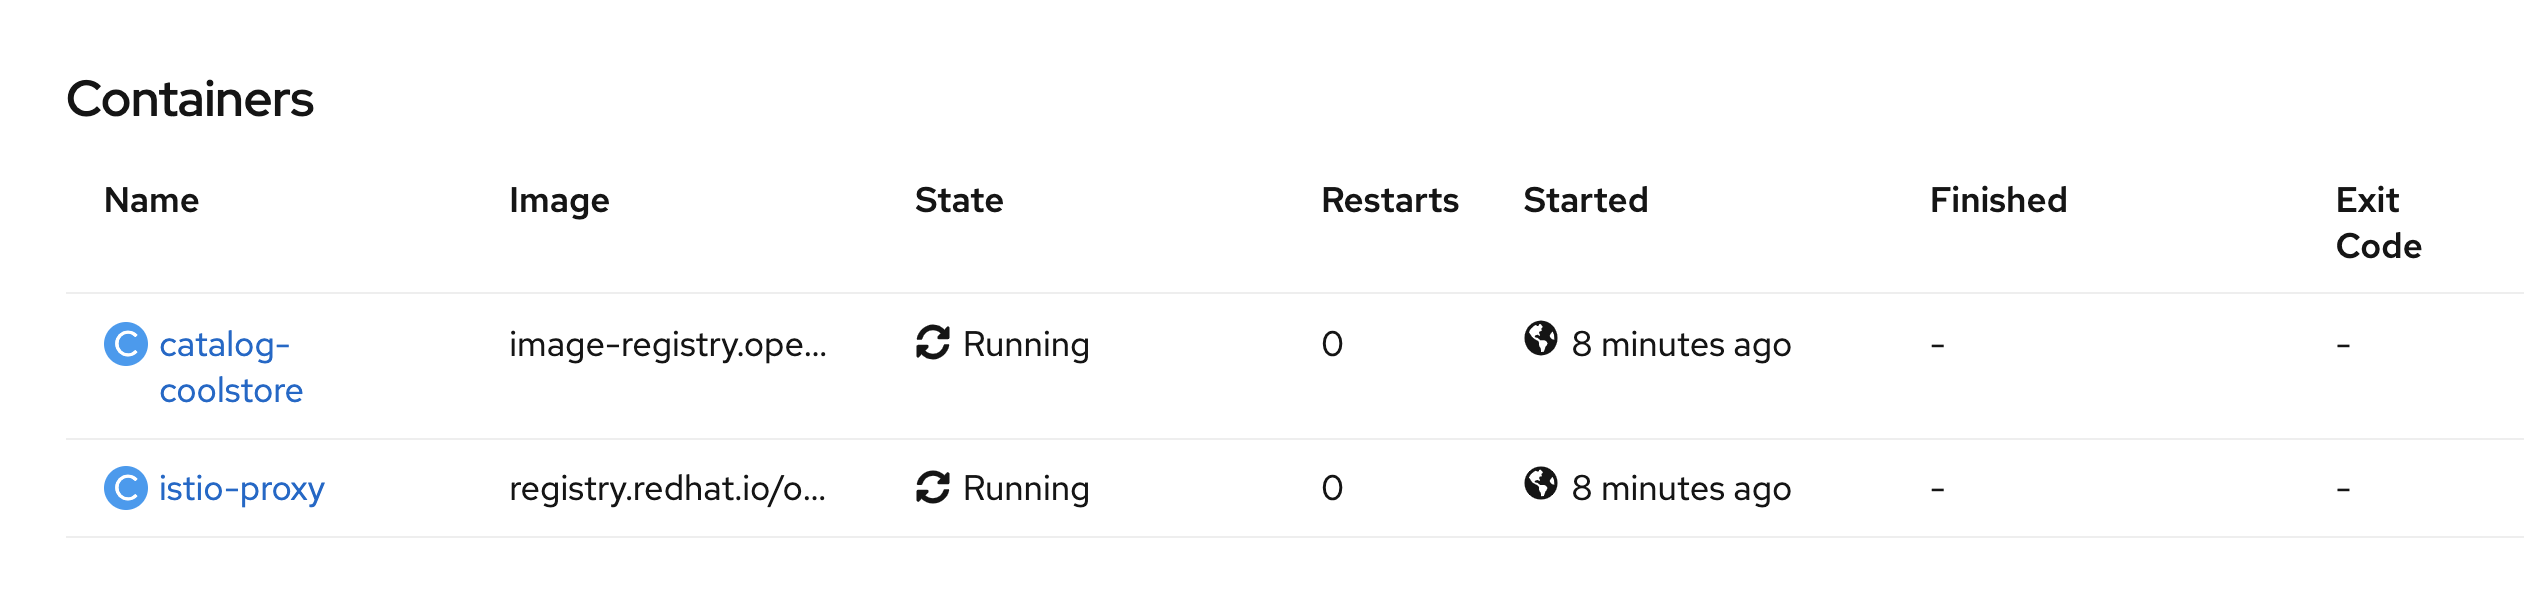
In the Container section, we should have 2 containers: One for the inventory-coolstore application and one for the istio-proxy sidecar.

Congratulations!! You successfully put the Inventory Service under Service Mesh control.
Enabling Service Mesh to Catalog and Gateway Service
Now, we understand how to enable Service Mesh for a service, reproduce the previous step for Catalog and Gateway Services.
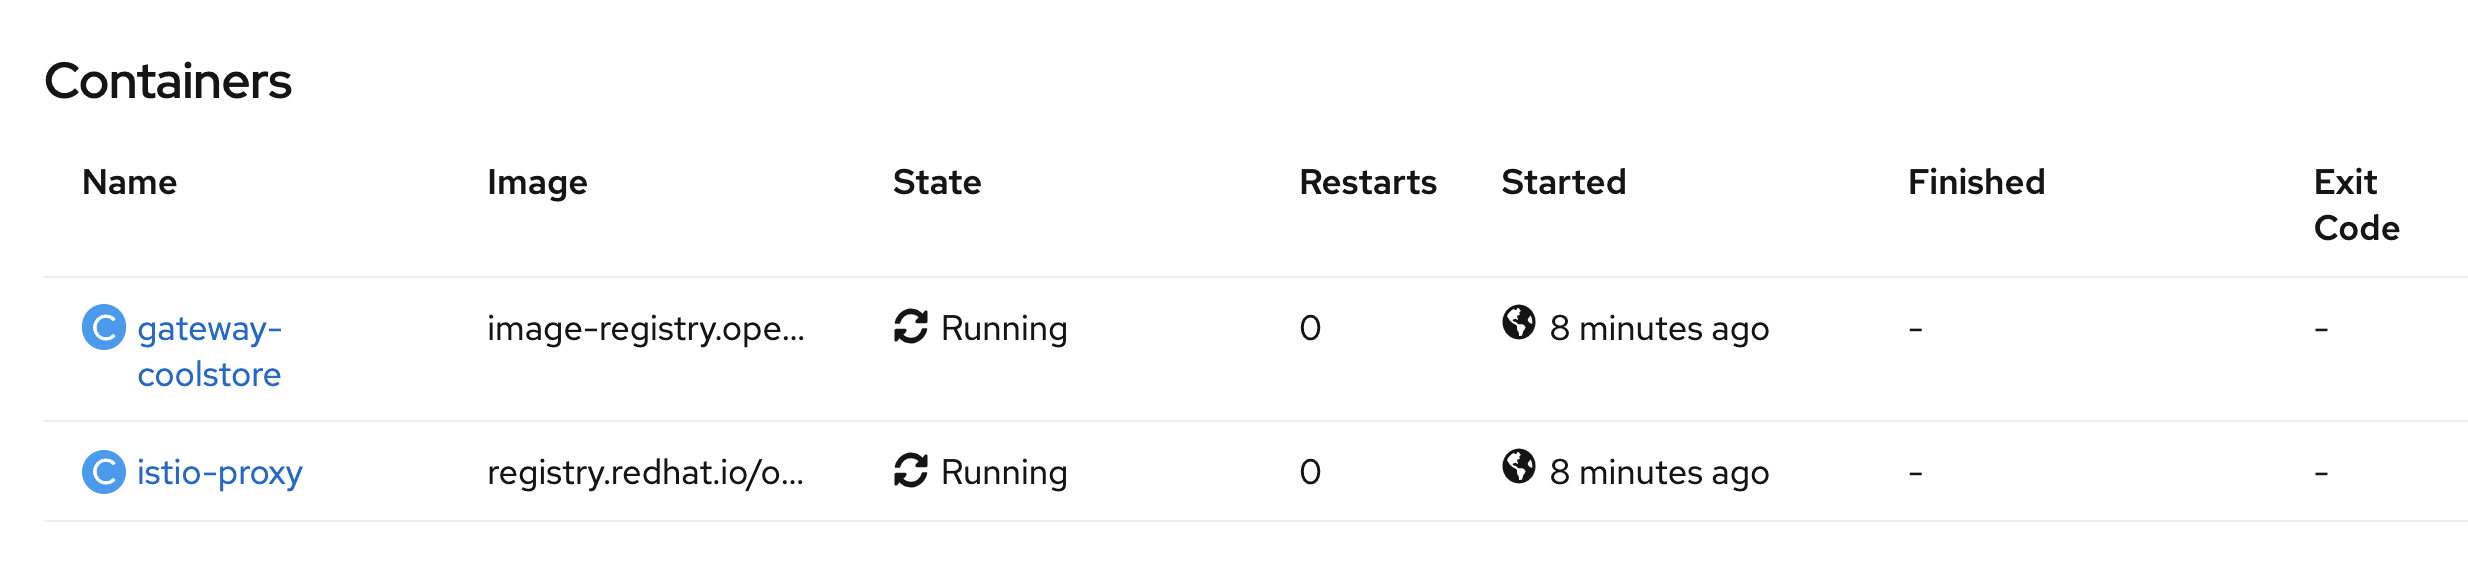
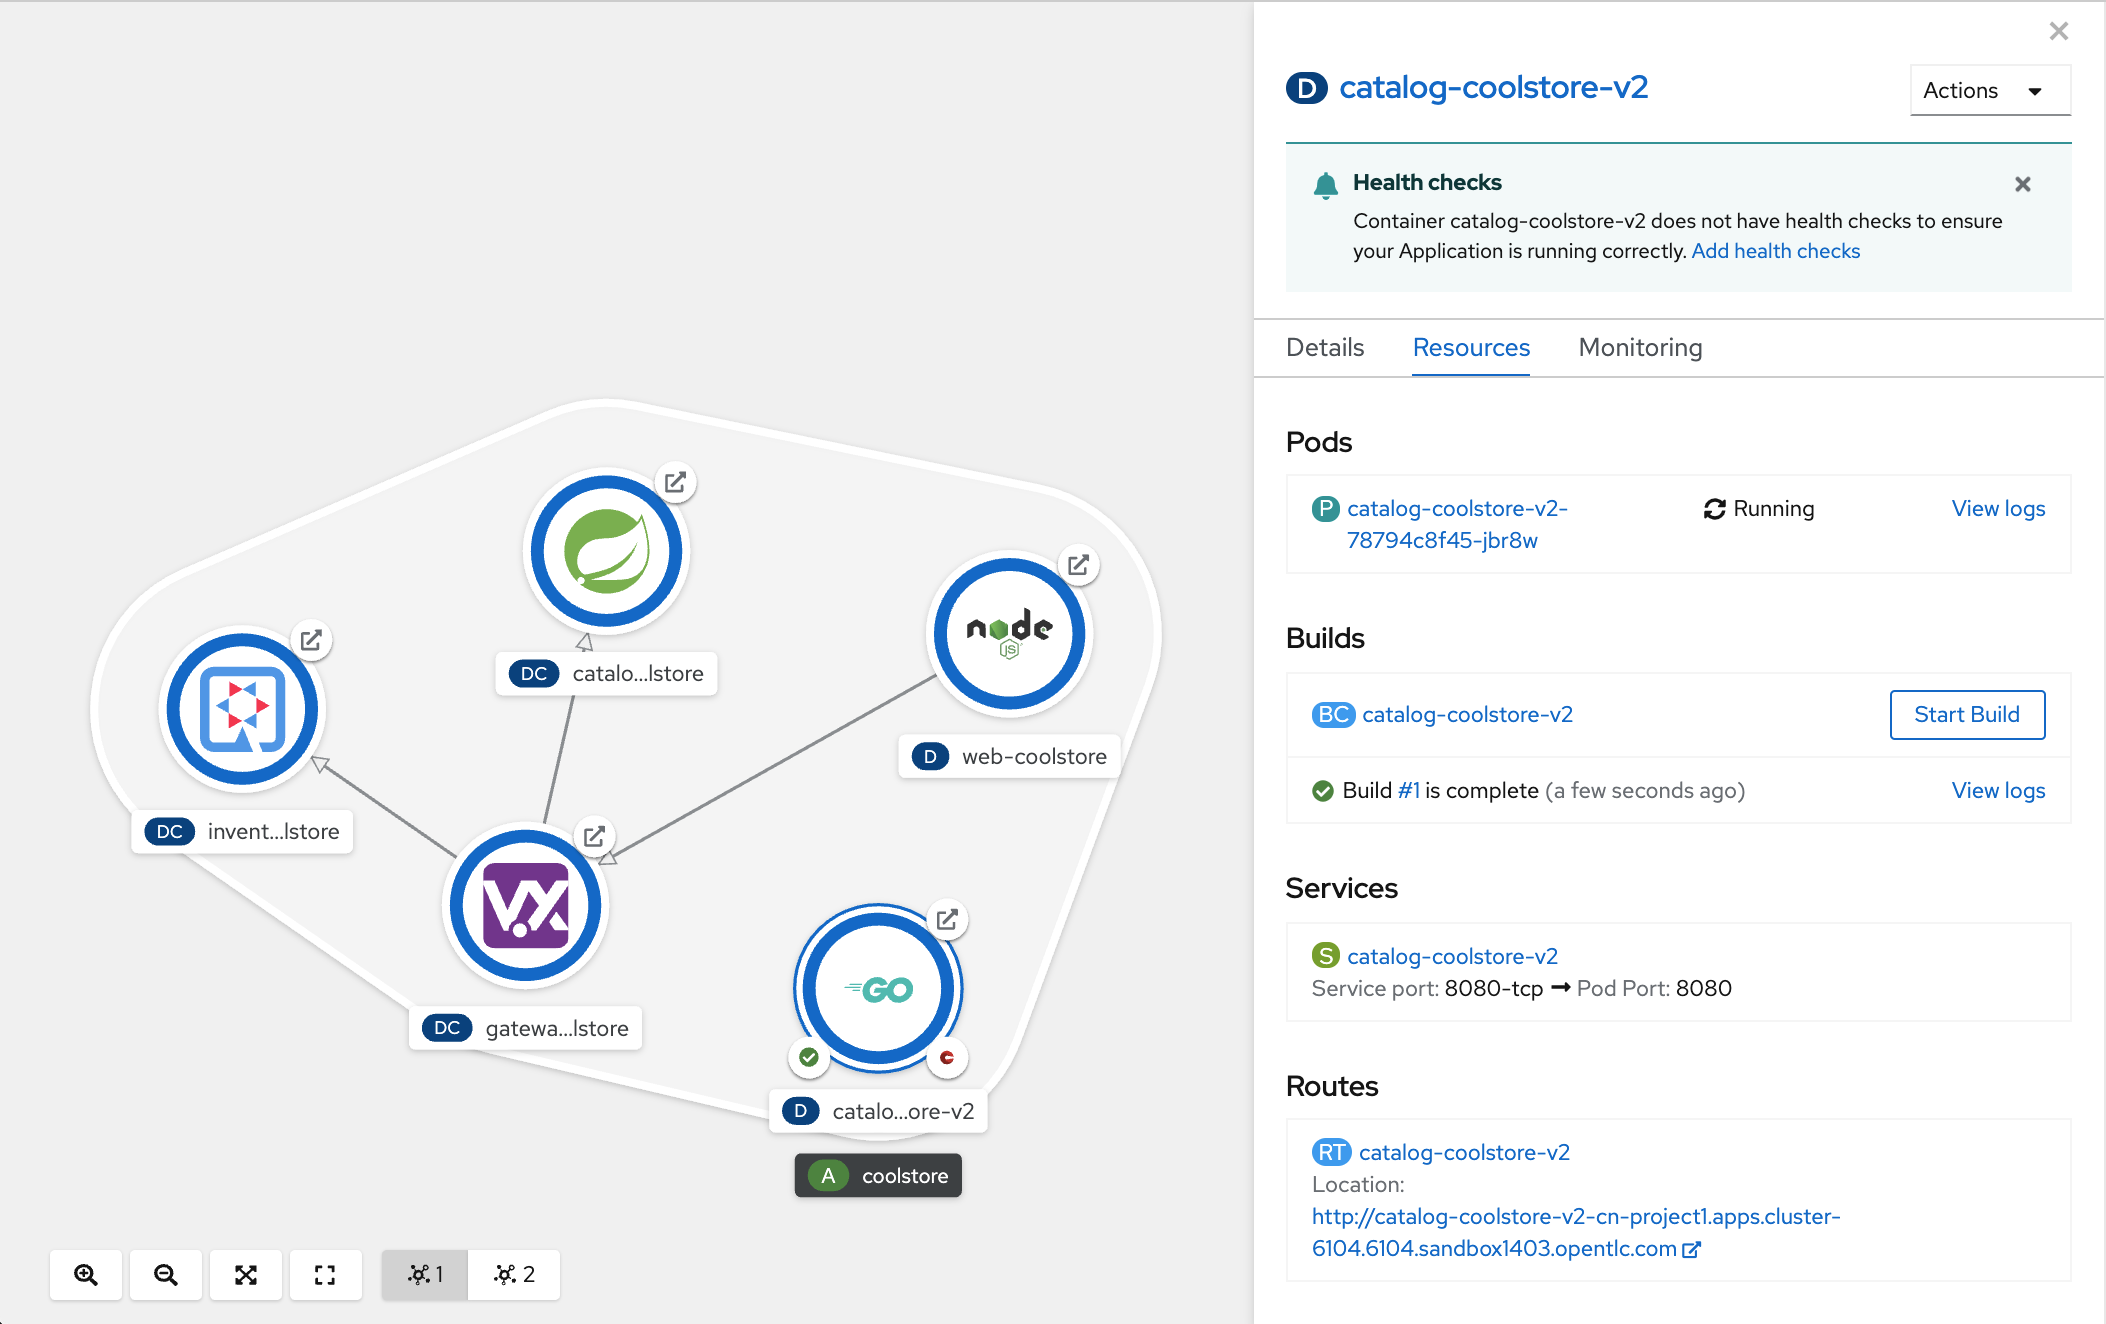
Once done, to verify the deployment, in the Container section of the 'catalog-coolstore-xxxx' and 'gateway-coolstore-xxxx' pods,
we should find the 2 containers, one for the application, the other the istio-proxy sidecar.
Controlling Ingress Traffic
In a OpenShift environment, the OpenShift Route is used to specify services that should be exposed outside the cluster. In an OpenShift Service Mesh, a better approach is to use a different configuration model, namely Istio Gateway.
|
Gateway describes a load balancer operating at the edge of the mesh receiving incoming or outgoing HTTP/TCP connections. The specification describes a set of ports that should be exposed, the type of protocol to use, SNI configuration for the load balancer, etc. VirtualService defines a set of traffic routing rules to apply when a host is addressed. Each routing rule defines matching criteria for traffic of a specific protocol. If the traffic is matched, then it is sent to a named destination service (or subset/version of it) defined in the registry. |
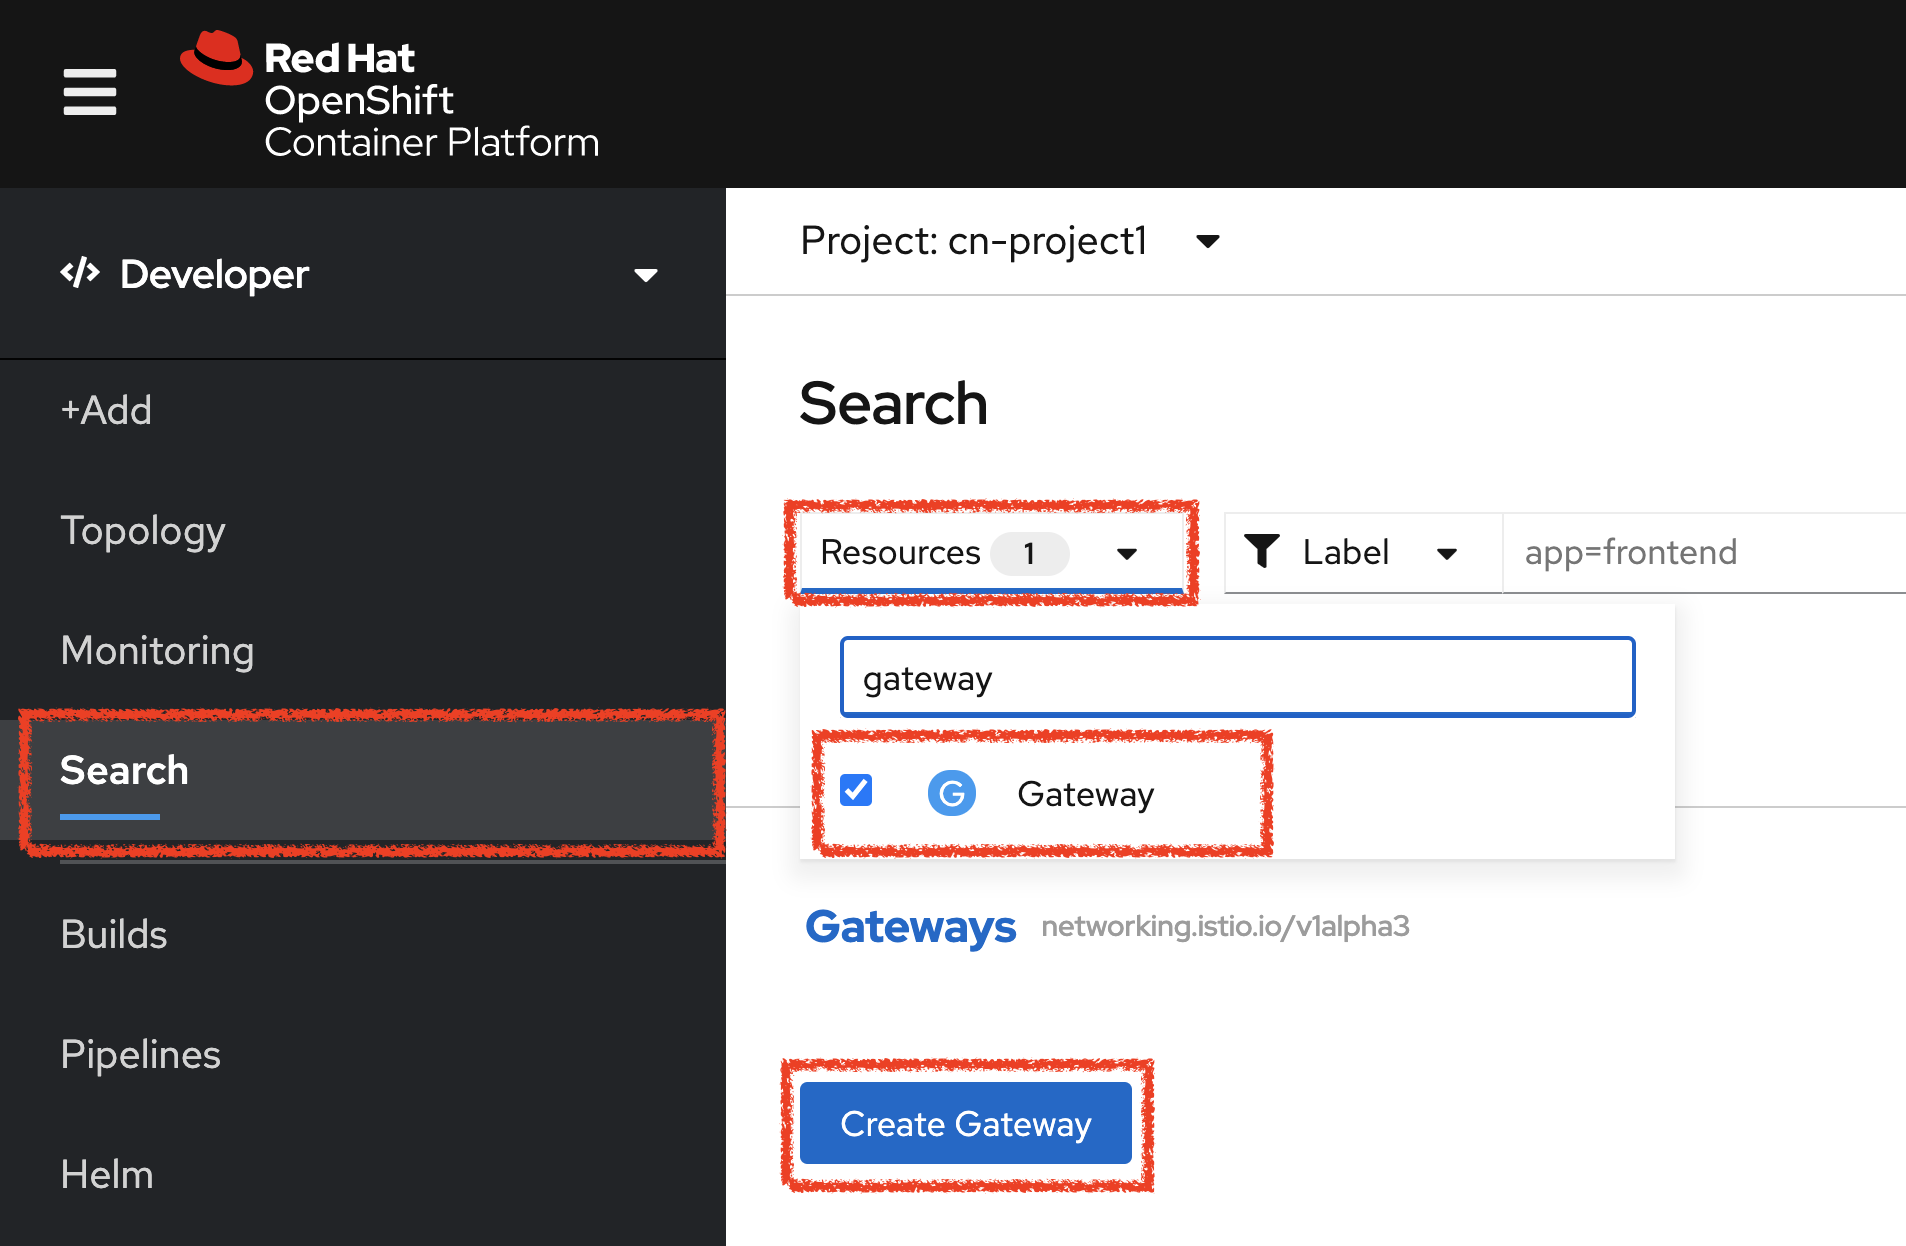
In the OpenShift Web Console, from the Developer view,
click on 'Search' → 'Resources' → 'G Gateway' → 'Create Gateway'.
Then update the content as follows:
apiVersion: networking.istio.io/v1beta1
kind: Gateway
metadata:
  name: gateway-coolstore
  namespace: cn-project%USER_ID%
spec:
  selector:
    istio: ingressgateway # use Istio default gateway implementation
  servers:
    - port:
        number: 80
        name: http
        protocol: HTTP
      hosts:
        - "*"
Click on 'create'. Your Istio Gateway is now created.
Then, click on 'Search' → 'Resources' → 'VS VirtualService' → 'Create VirtualService'.
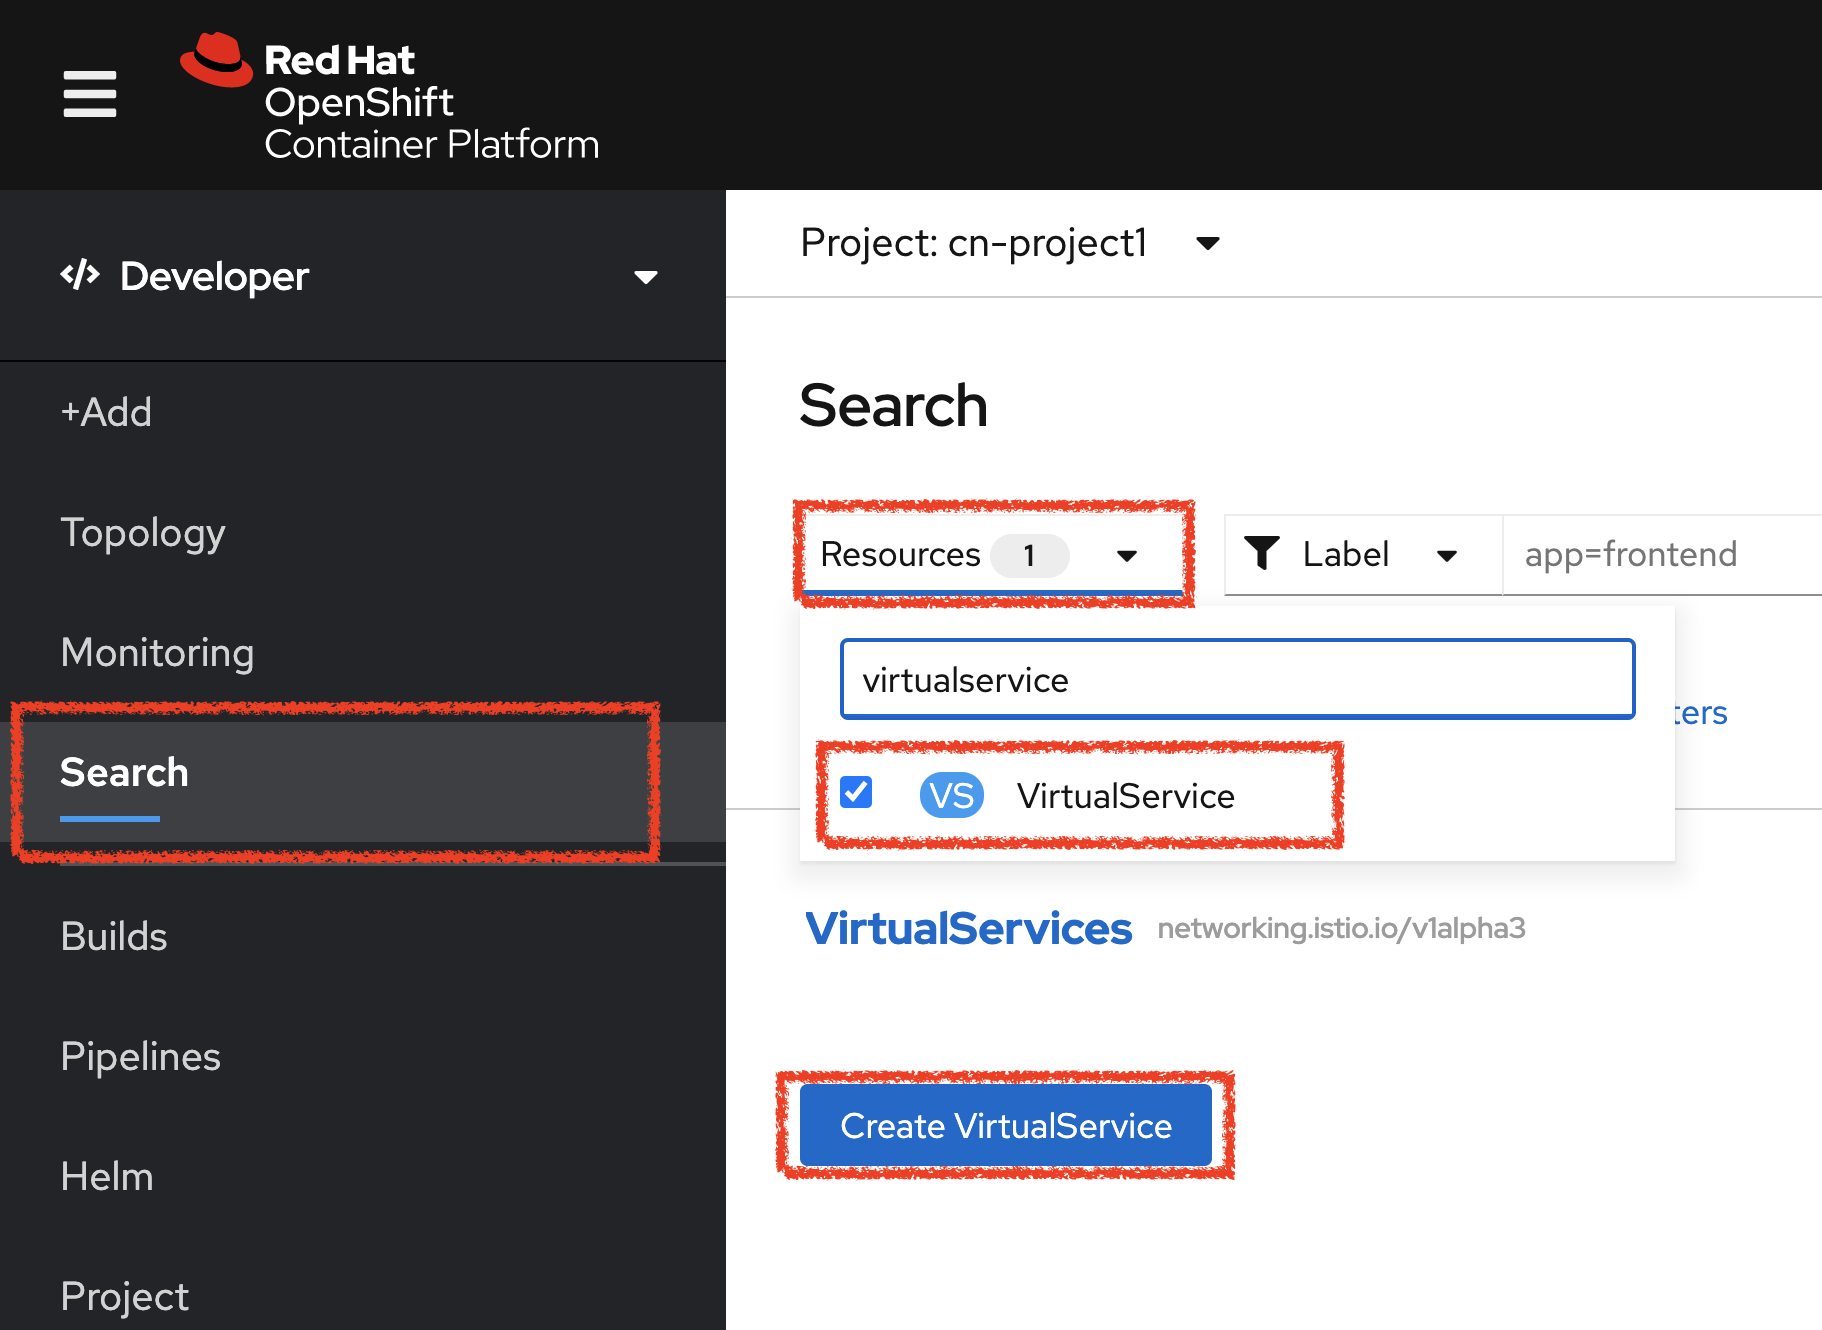
Then update the content as follows:
apiVersion: networking.istio.io/v1beta1
kind: VirtualService
metadata:
  name: gateway-coolstore
  namespace: cn-project%USER_ID%
spec:
  hosts:
    - "*"
  gateways:
    - gateway-coolstore
  http:
    - match:
        - uri:
            prefix: /cn-project%USER_ID%/api
      rewrite:
        uri: "/api"
      route:
        - destination:
            port:
              number: 8080
            host: gateway-coolstore
Then click on 'create'. The Virtual Service for the Gateway Service is now created.
To confirm that the Istio Gateway is properly configured,
click on http://istio-ingressgateway-istio-system.%APPS_HOSTNAME_SUFFIX%/cn-project%USER_ID%/api/products
You should have the following result:
[ {
  "itemId" : "329299",
  "name" : "Red Fedora",
  "desc" : "Official Red Hat Fedora",
  "price" : 34.99,
  "availability" : {
    "quantity" : 35
  }
},
...
]
Updating the WebUI to use the Istio Gateway
Configure the WebUI Service to use the Istio Gateway instead of the OpenShift Route.
In the OpenShift Web Console, from the Developer view,
click on the 'D web-coolstore' bubble → 'D web-coolstore' and go to the 'Environement' tab
Click on '+ Add Value' then add the following environment variable
| Key | Value |
|---|---|
COOLSTORE_GW_ENDPOINT |
http://istio-ingressgateway-istio-system.%APPS_HOSTNAME_SUFFIX%/cn-project%USER_ID% |
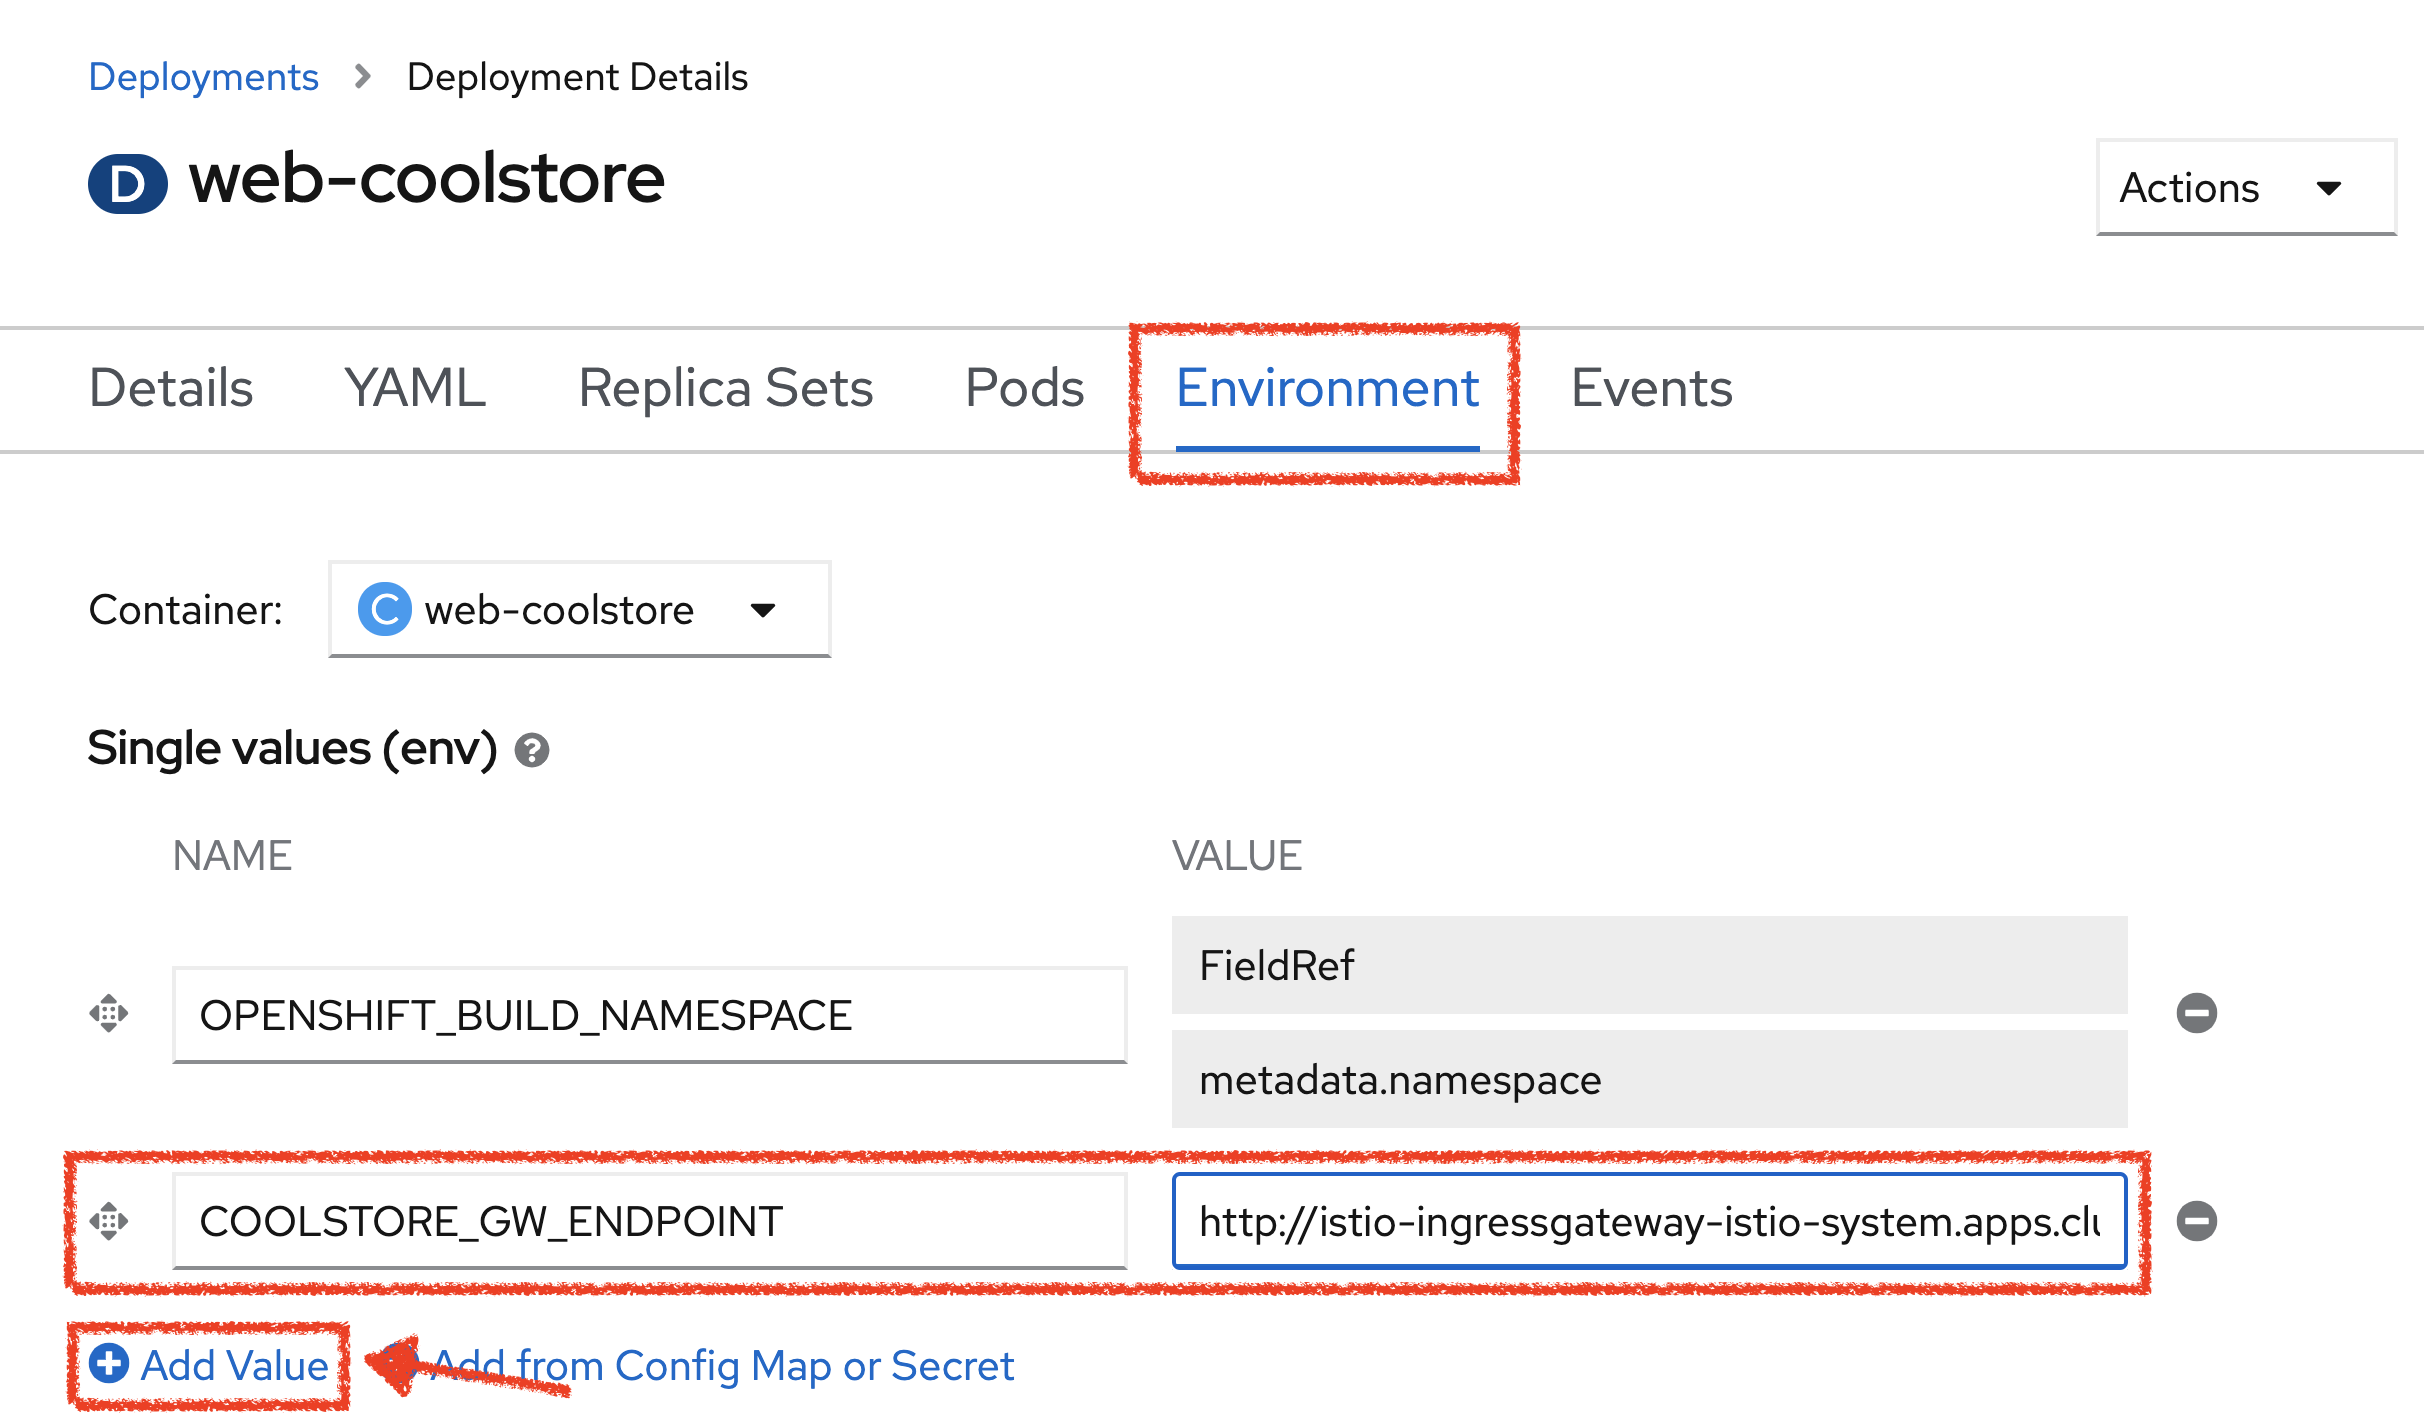
Click on 'Save'. The WebUI Service will be redeployed with the new environment variable.
Testing the application
Point your browser at the Web UI route url. You should be able to see the CoolStore with all products and their inventory status.
| Refresh your browser several times to generate traffic. |
What is Kiali?
A Microservice Architecture breaks up the monolith into many smaller pieces that are composed together. Patterns to secure the communication between services like fault tolerance (via timeout, retry, circuit breaking, etc.) are needed as well as distributed tracing to be able to see where calls are going.
A service mesh can now provide these services at a platform level and free the developer from those tasks. Routing decisions are done at the mesh level.
Kiali works with Istio, in OpenShift or Kubernetes, to visualize the service mesh topology, to provide visibility into features like circuit breakers, request rates and more. It offers insights about the mesh components at different levels, from abstract Applications to Services and Workloads.
Observability with Kiali
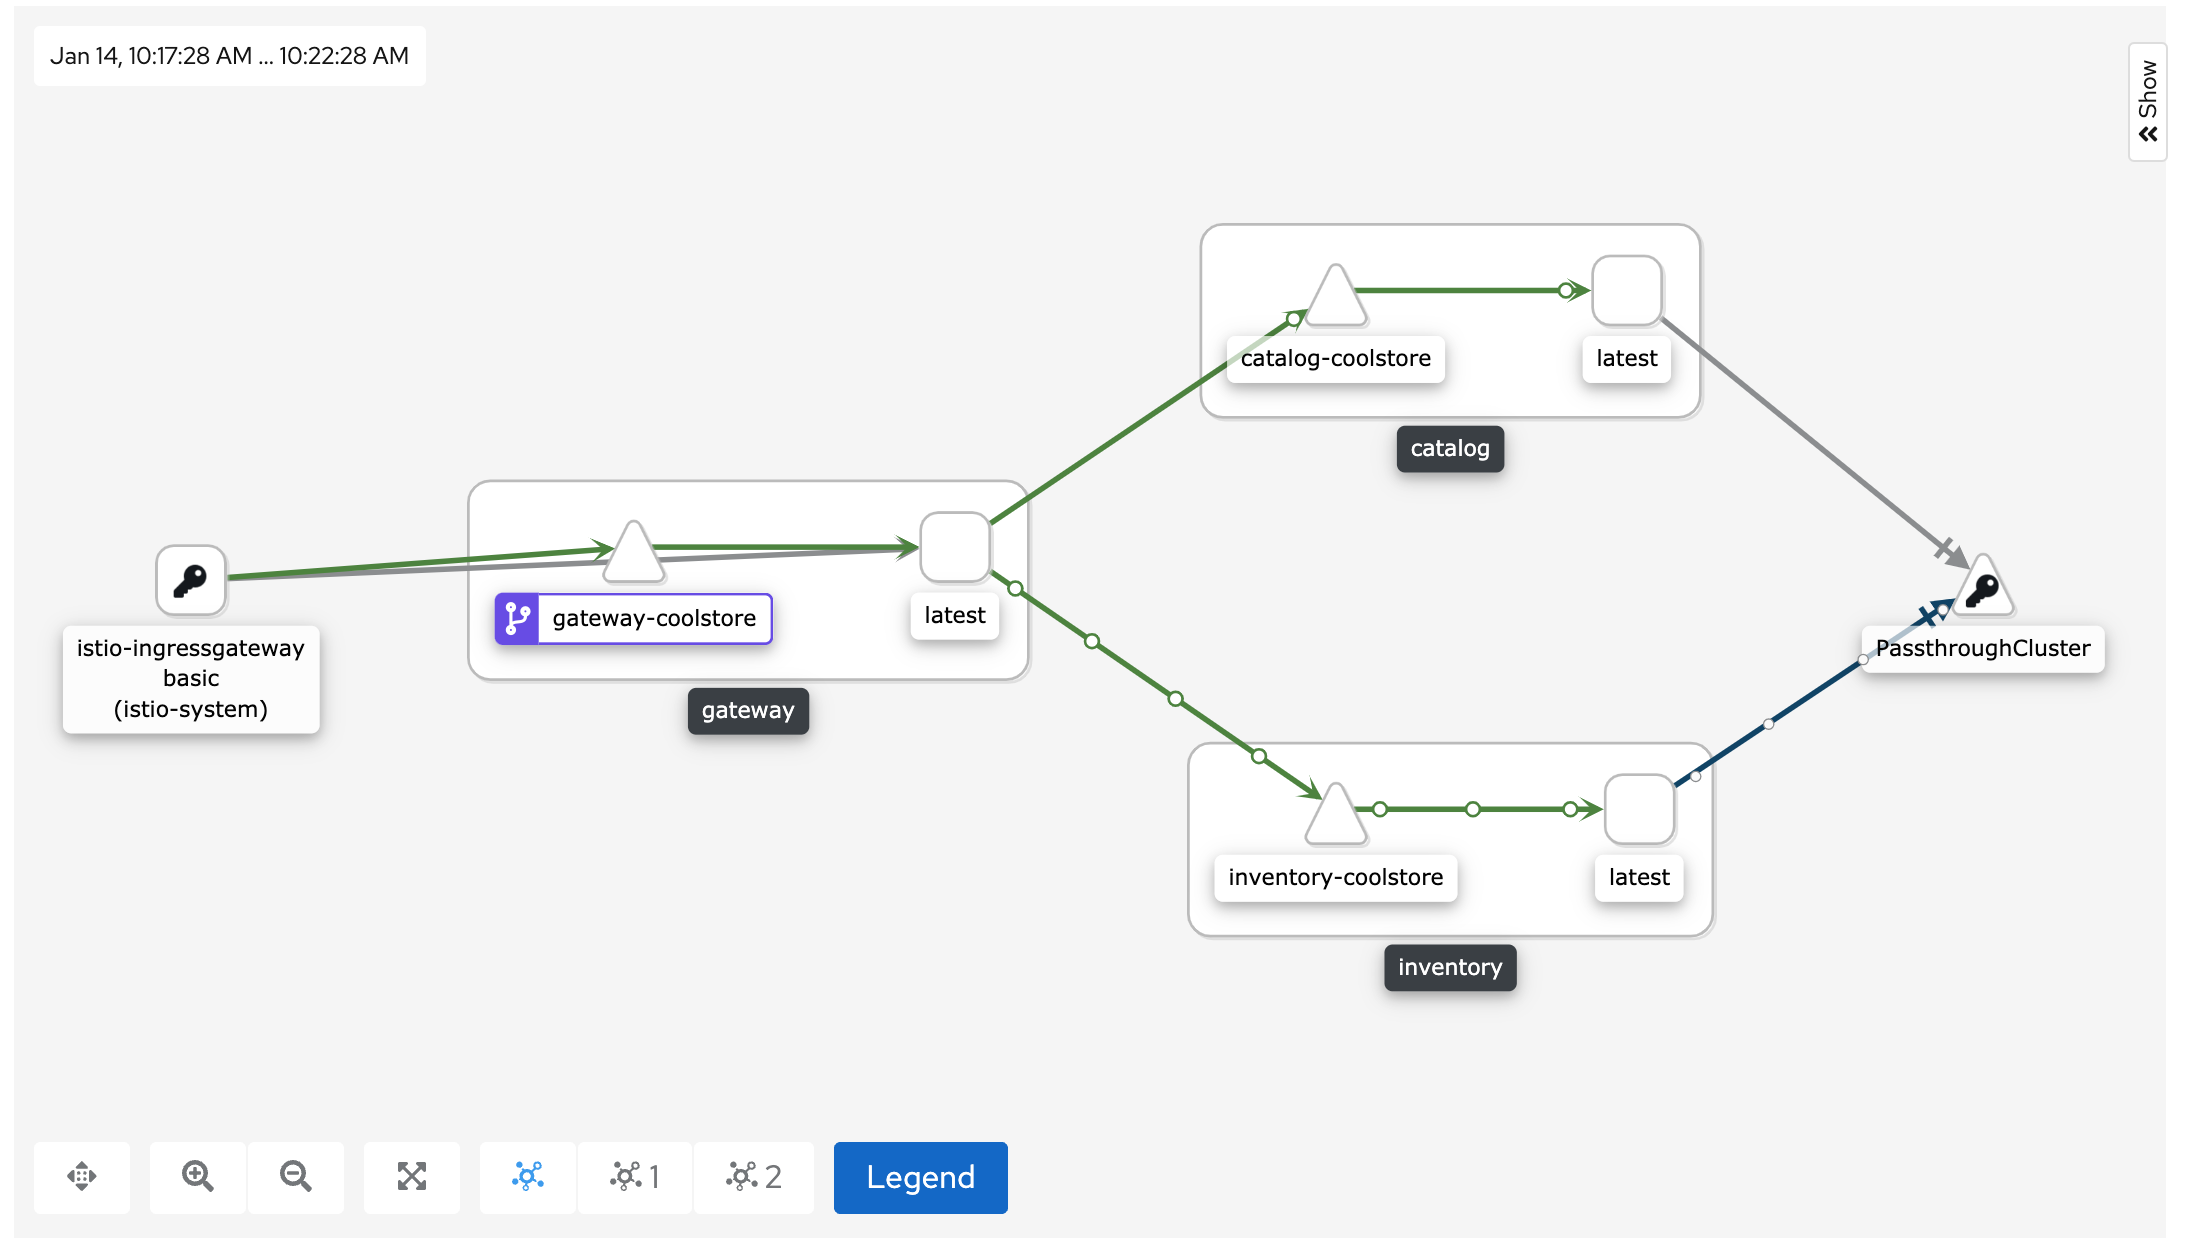
Kiali provides an interactive graph view of your namespace in real time, being able to display the interactions at several levels (applications, versions, workloads), with contextual information and charts on the selected graph node or edge.
Click on the 'Developer Observability' button below

Then, log in with OpenShift as user%USER_ID%/%OPENSHIFT_PASSWORD%'
In the 'Graph' view, enter the following configuration:
| Parameter | Value |
|---|---|
Namespace |
cn-project%USER_ID% |
Type Graph |
Versioned app graph |
Display |
'Traffic Animation' checked |
Hide |
node = unknown OR service*=PassthroughCluster |
The outcome is a graph with all the services, connected by the requests going through them. You can see how the services interact with each other.
Deploy the new Catalog Service
A new Catalog Service v2 has been implemented in Golang which uses the same business logic than Catalog Service v1 except that all product descriptions are returned in UPPERCASE.
Let’s deploy the service. In the OpenShift Web Console, from the Developer view,
click on '+ Add' and select 'From Docker'
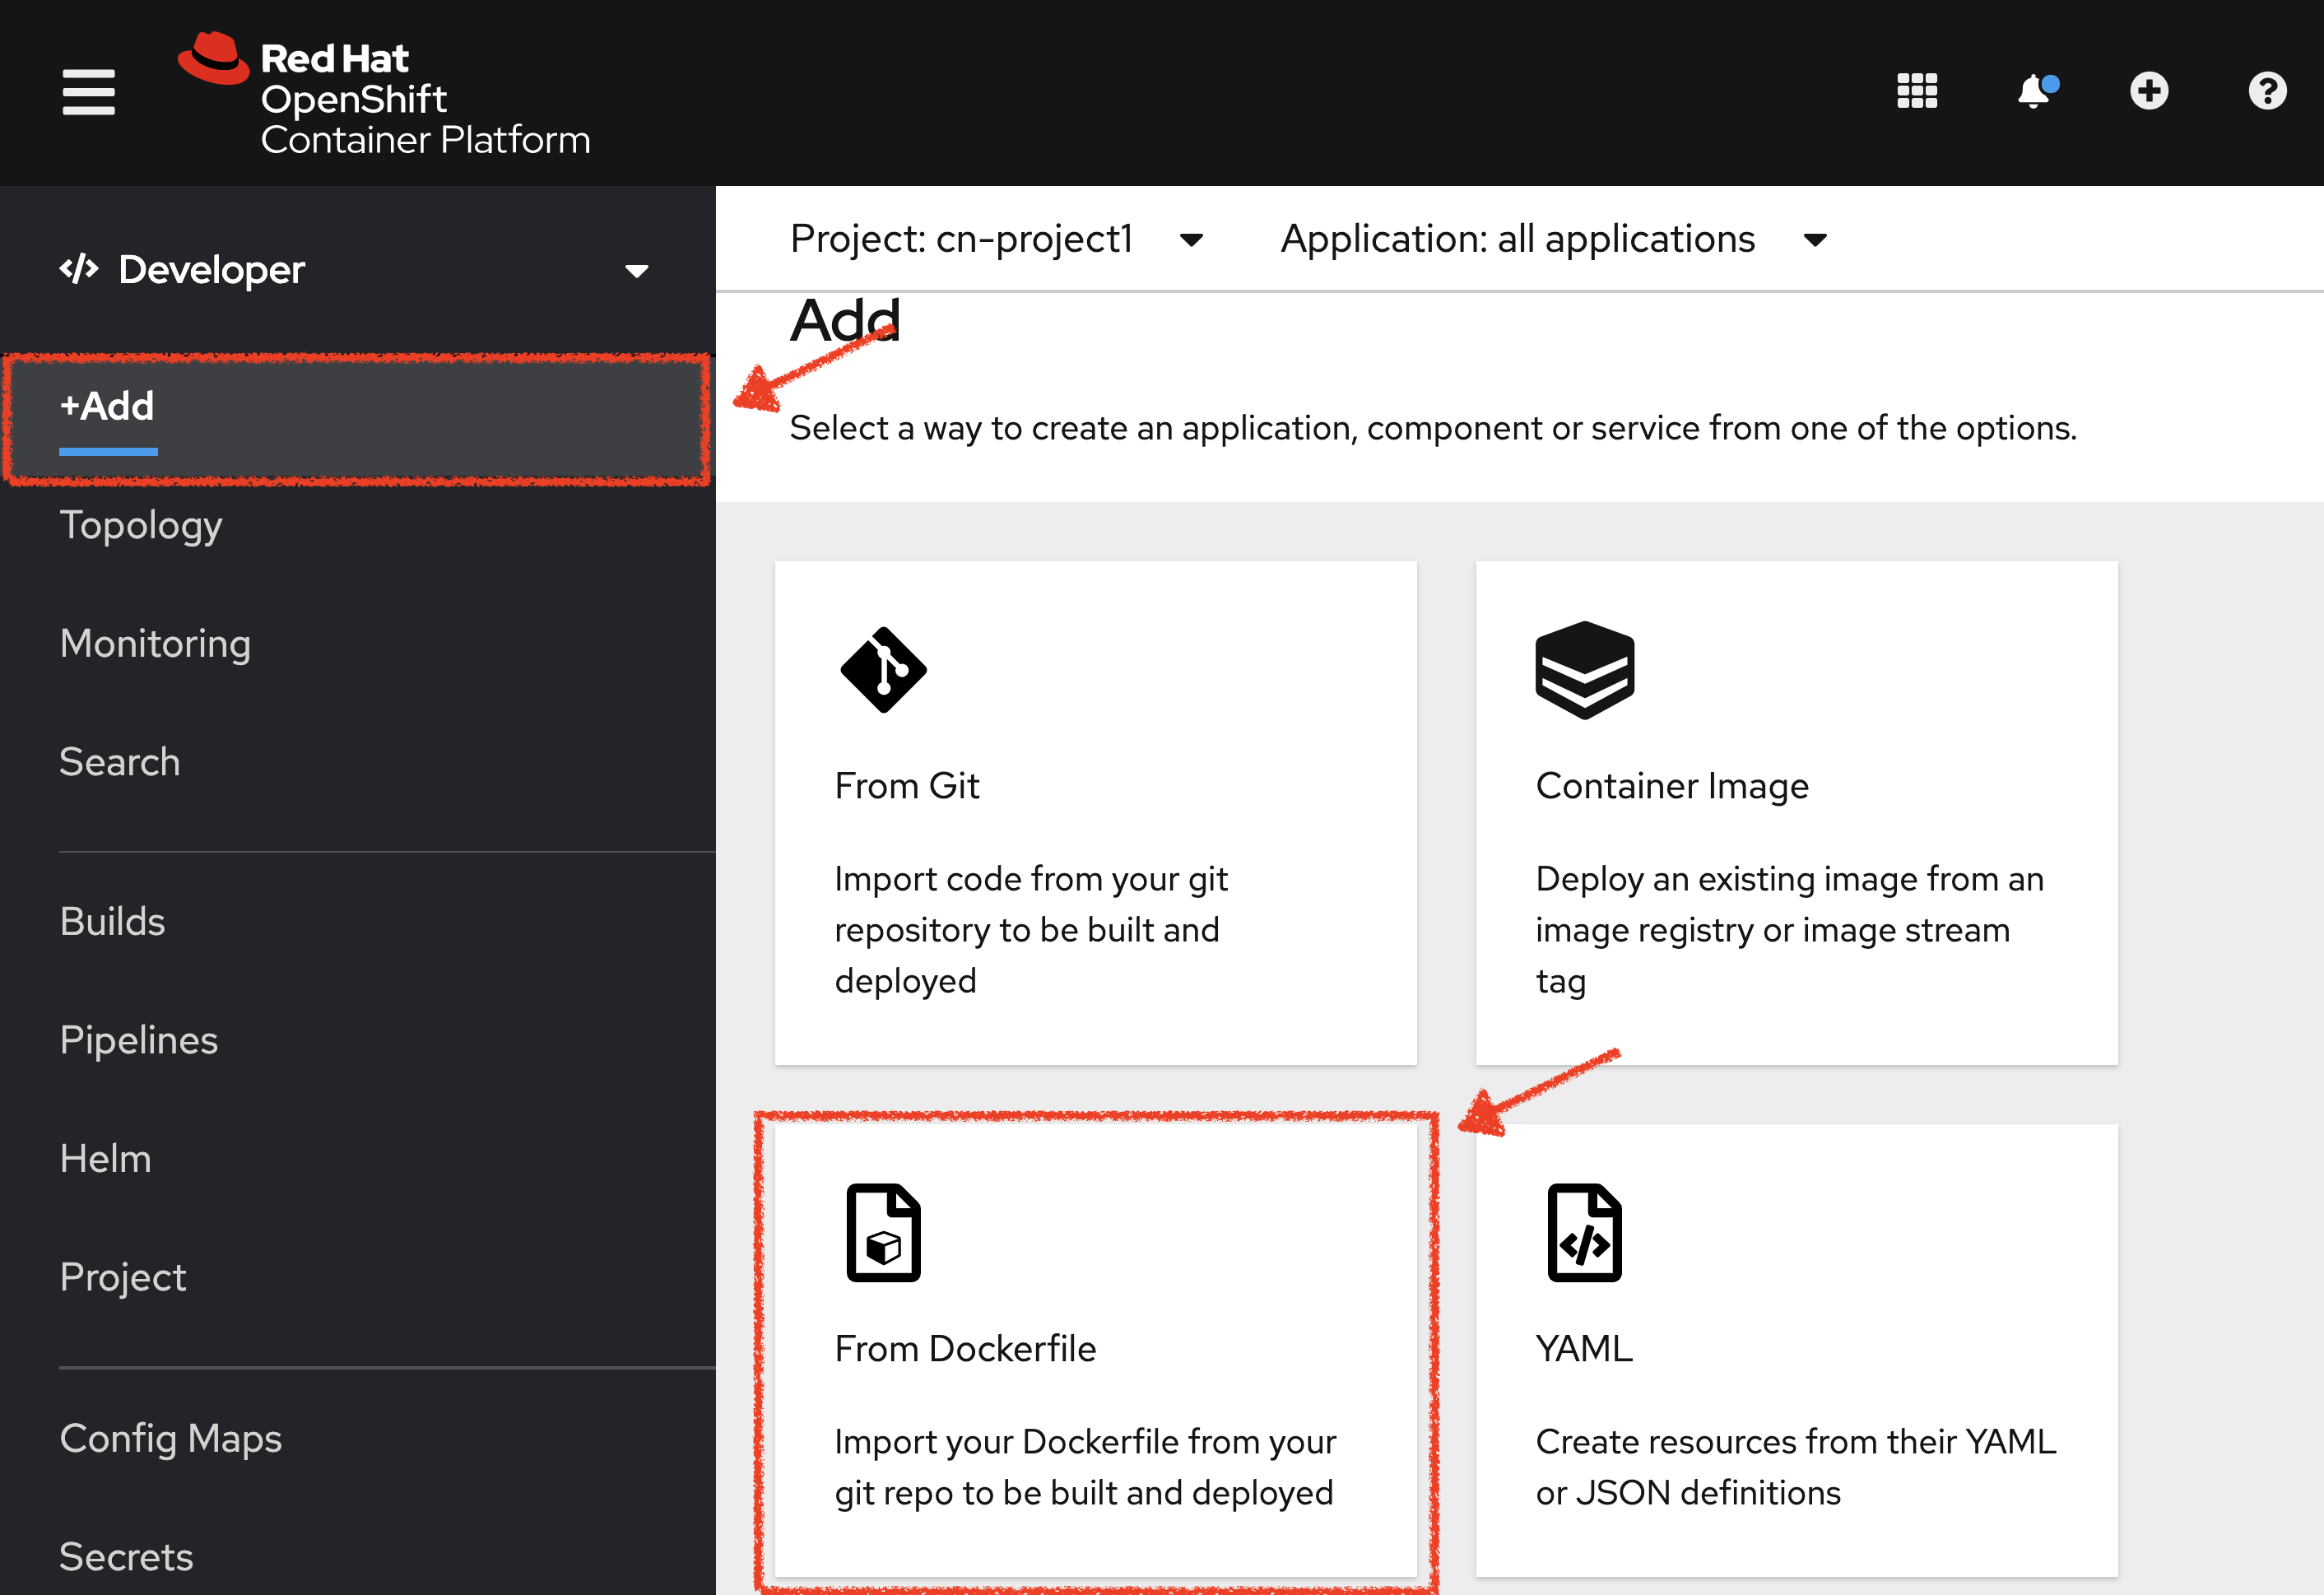
Then, enter the following information and click on 'Create' button :
| Parameter | Value |
|---|---|
Git Repo URL |
%WORKSHOP_GIT_REPO% |
Git Reference |
%WORKSHOP_GIT_REF% |
Context Dir |
/labs/catalog-go |
Application Name |
coolstore |
Name |
catalog-coolstore-v2 |
Resources |
Deployment |
Create a route to the application |
Checked |
Labels |
app.kubernetes.io/name=golang |
Enabling A/B Testing
The implementation of such procedure like A/B Testing is one are the advantages coming with OpenShift Service Mesh. For this lab, you want to answer the following question:
Do the product descriptions written in uppercase increase sales rate?
The only step is to define the rules to distribute the traffic between the services. A VirtualService defines a set of traffic routing rules to apply when a host is addressed. Each routing rule defines matching criteria for traffic of a specific protocol. If the traffic is matched, then it is sent to a named destination service (or subset/version of it) defined in the registry.
In the OpenShift Web Console, from the Developer view,
click on 'Search' → 'Resources' → 'VS VirtualService' → 'Create VirtualService'.
Then update the content as follows:
apiVersion: networking.istio.io/v1beta1
kind: VirtualService
metadata:
  name: catalog-coolstore
  namespace: cn-project%USER_ID%
spec:
  hosts:
    - catalog-coolstore
  http:
  - route:
    - destination:
        host: catalog-coolstore
      weight: 90
    - destination:
        host: catalog-coolstore-v2
      weight: 10
Click on 'create'. By doing so, you route 90% of the HTTP traffic to pods of the Catalog Service and
the 10% remaining to pods of the Catalog Service v2.
Generate HTTP traffic.
Let’s now see the A/B testing with Site Mesh in action. First, we need to generate HTTP traffic by sending several requests to the Gateway Service from the Istio Gateway
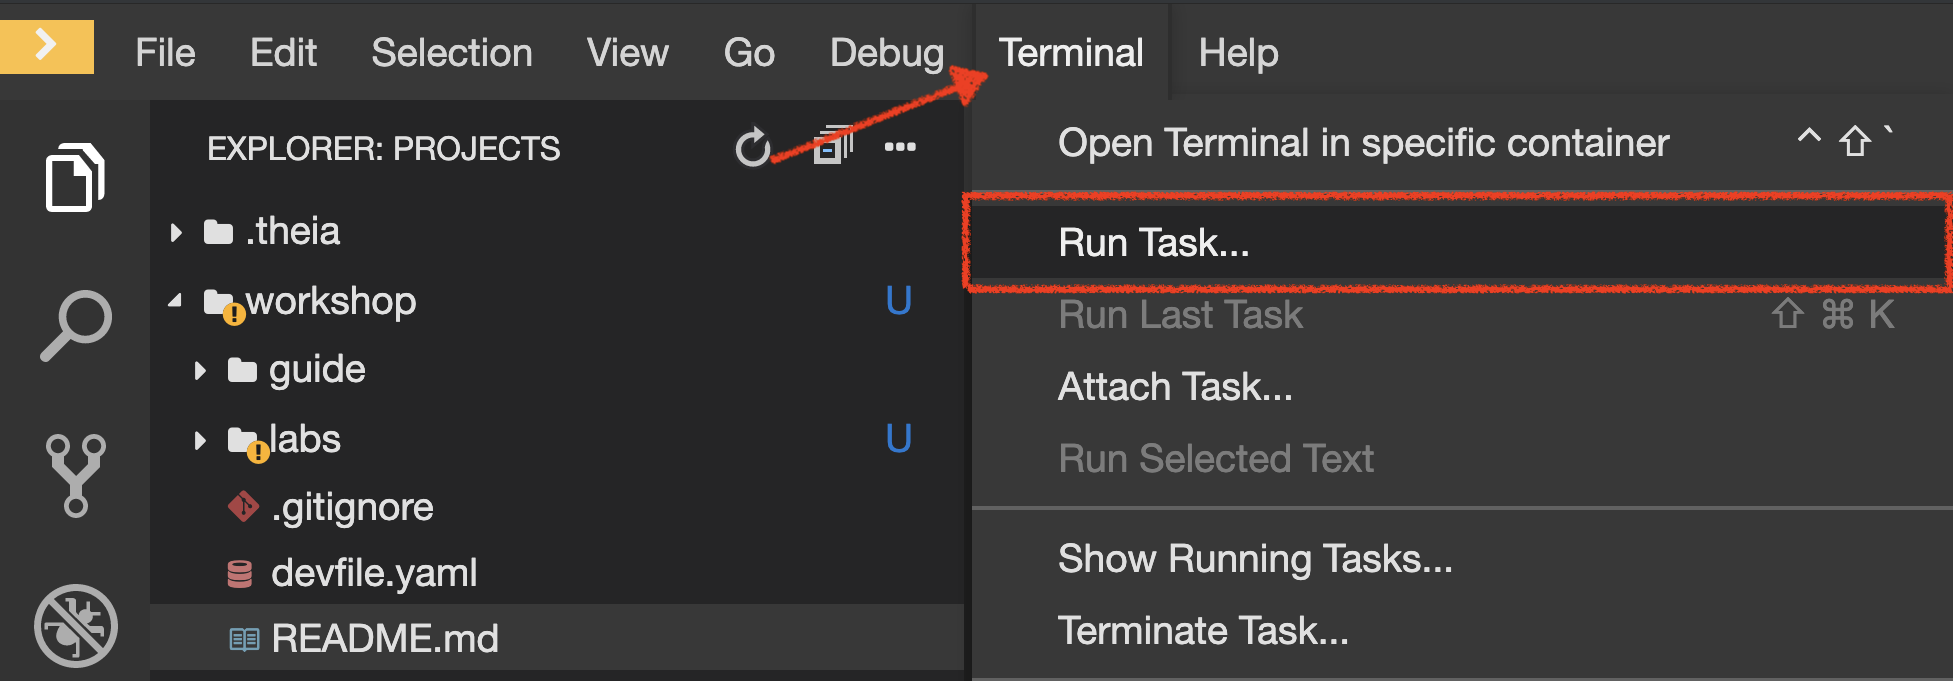
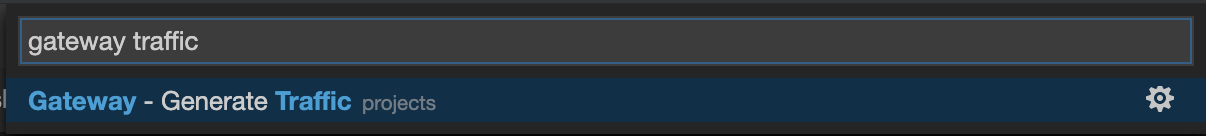
In your Workspace, click on 'Terminal' → 'Run Task…' → 'Gateway - Generate Traffic'
In the ''>_ Gateway - Generate Traffic' terminal window, you likely see 'Gateway ⇒ Catalog Spring Boot (v1)' or 'Gateway ⇒ Catalog GoLang (v2)'
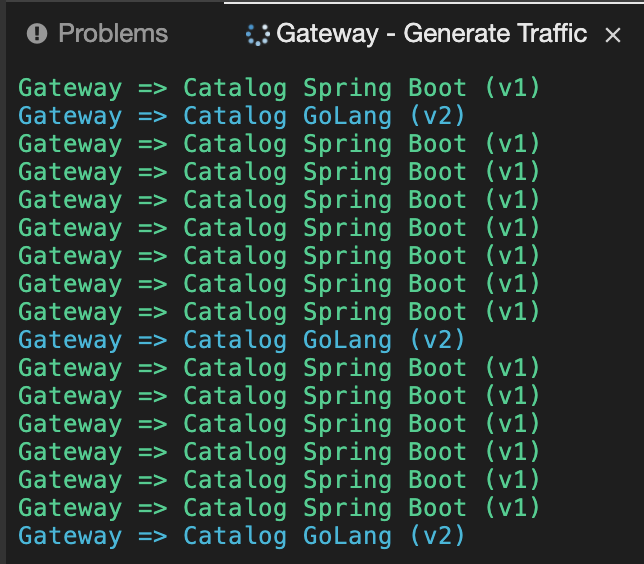
| You can also access your CoolStore from your browser and refresh the page to see that product descriptions is sometimes in uppercase (v2) or not (v1). |
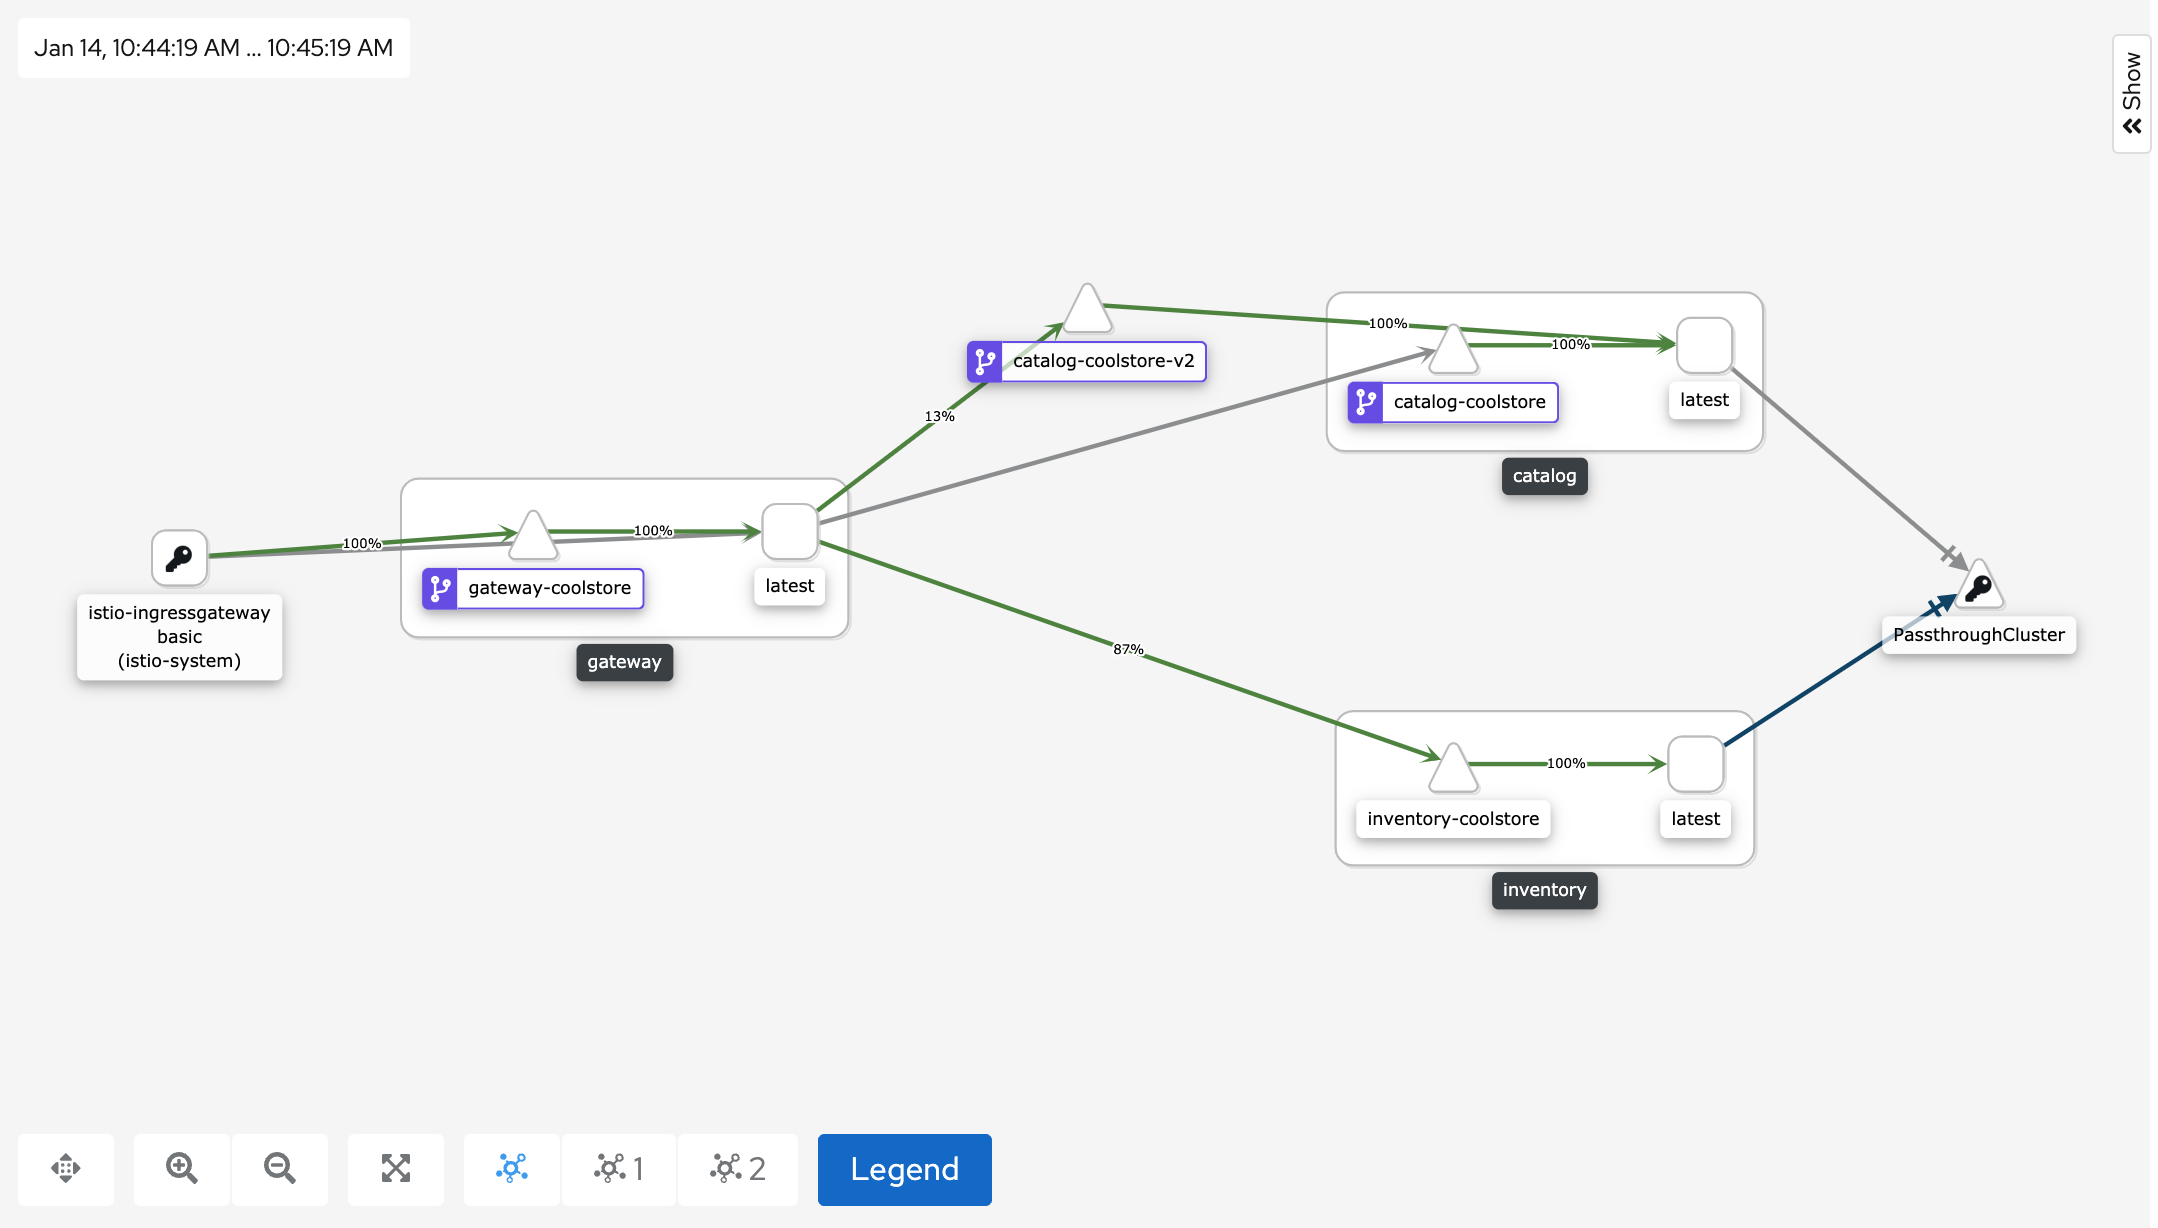
In Kiali Console, from the 'Graph' view,
enter the following parameters to see the traffic distribution between Catalog v1 and v2:
| Parameter | Value |
|---|---|
Namespace |
cn-project%USER_ID% |
Type Graph |
Versioned app graph |
Edge Label |
Requests percentage |
Display |
'Traffic Animation' checked |
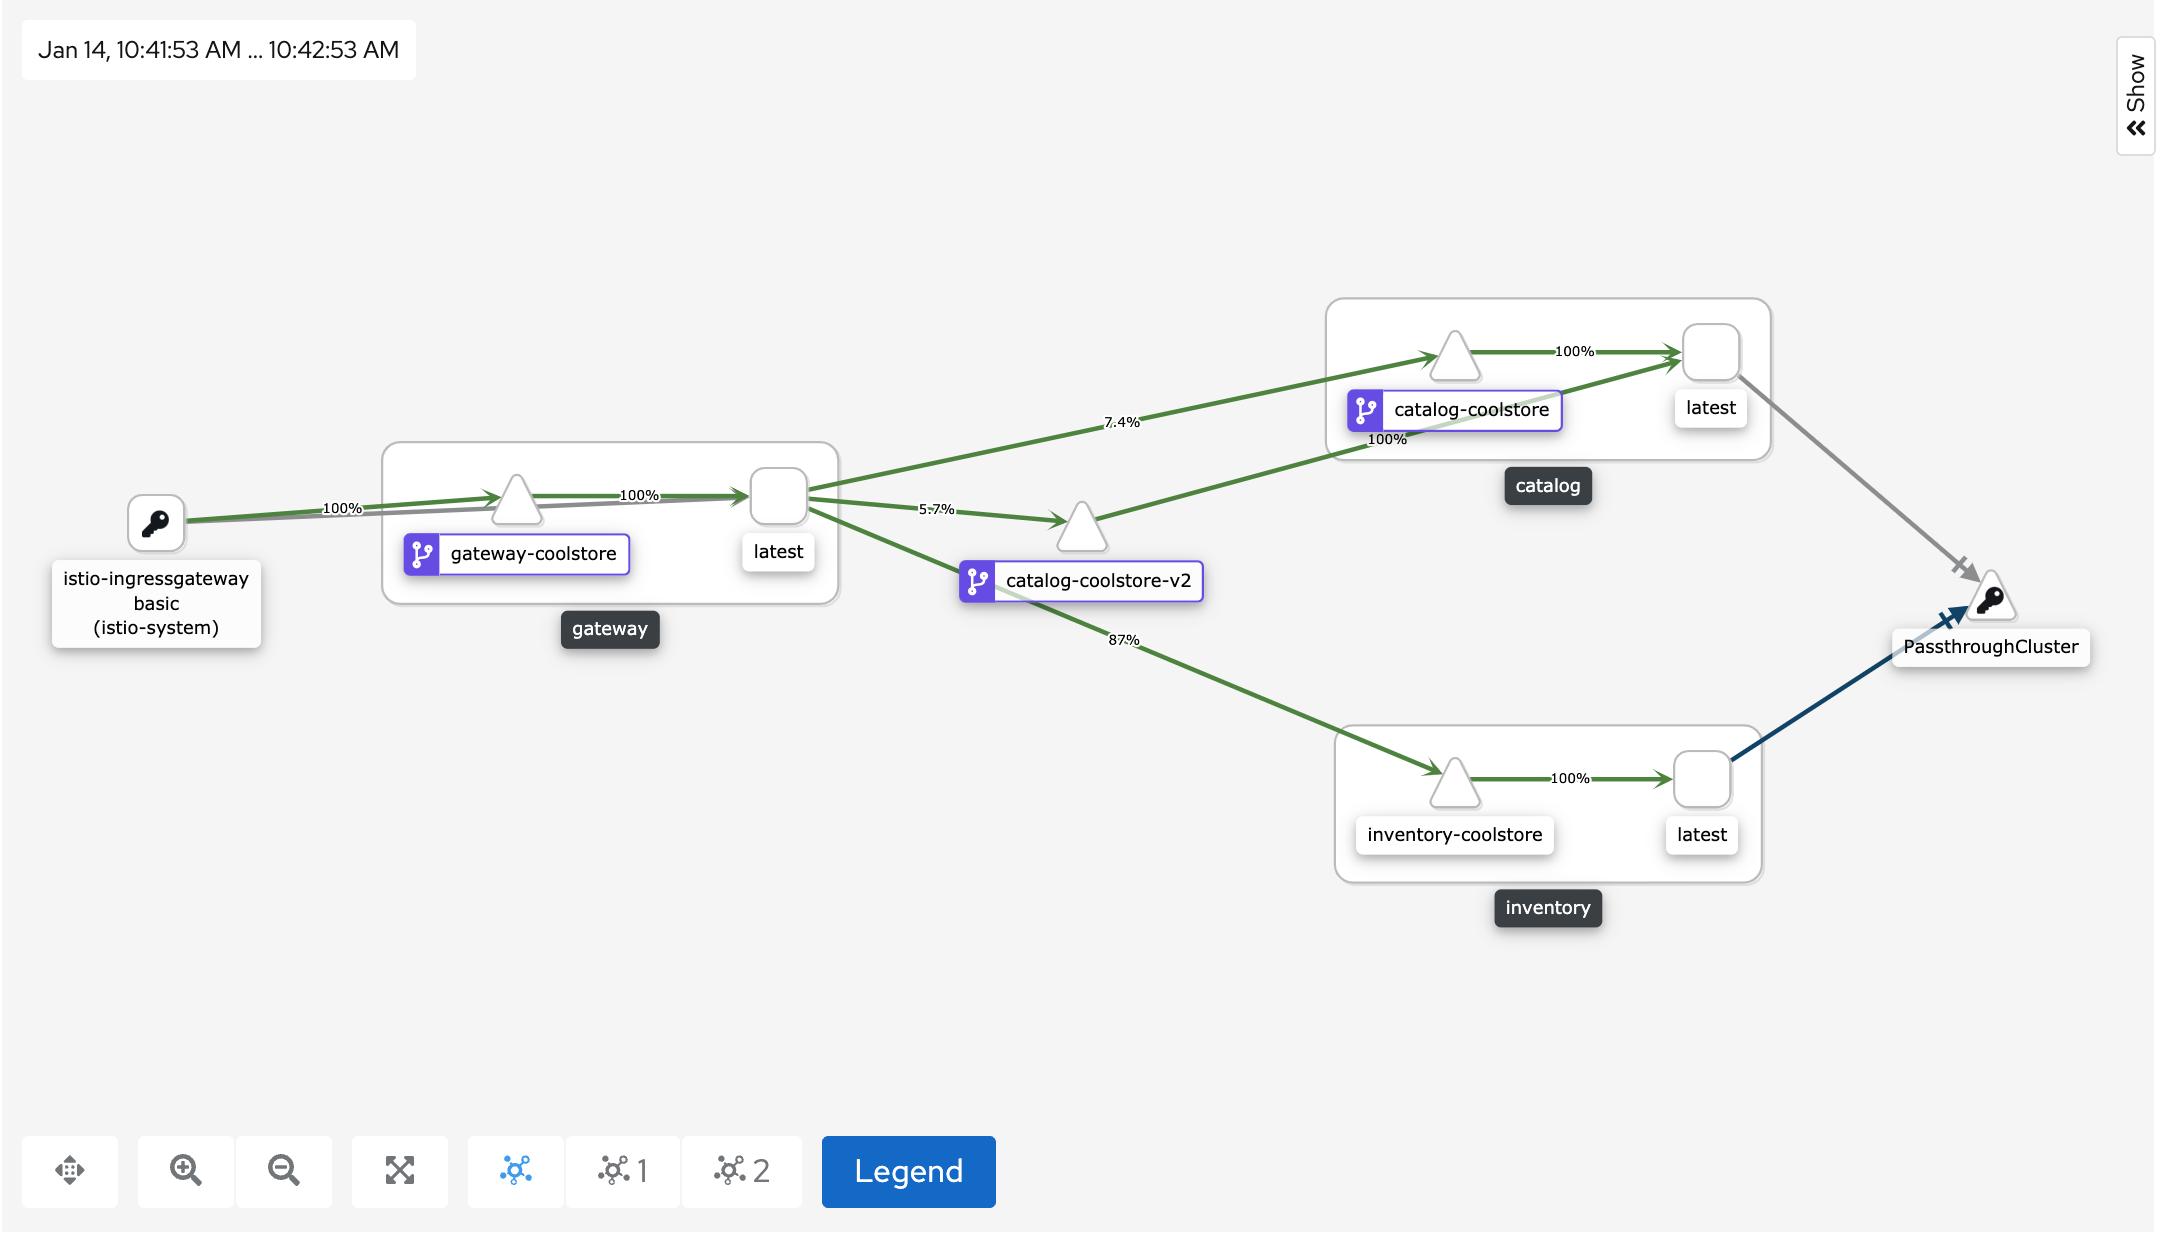
You can see that the traffic between the two version of the Catalog is shared as defined (at least very very close).
Validate the result
After one week trial, you have collected enough information to confirm that product descriptions in uppercase do increate sales rates. So you will route all the traffic to Catalog Service v2.
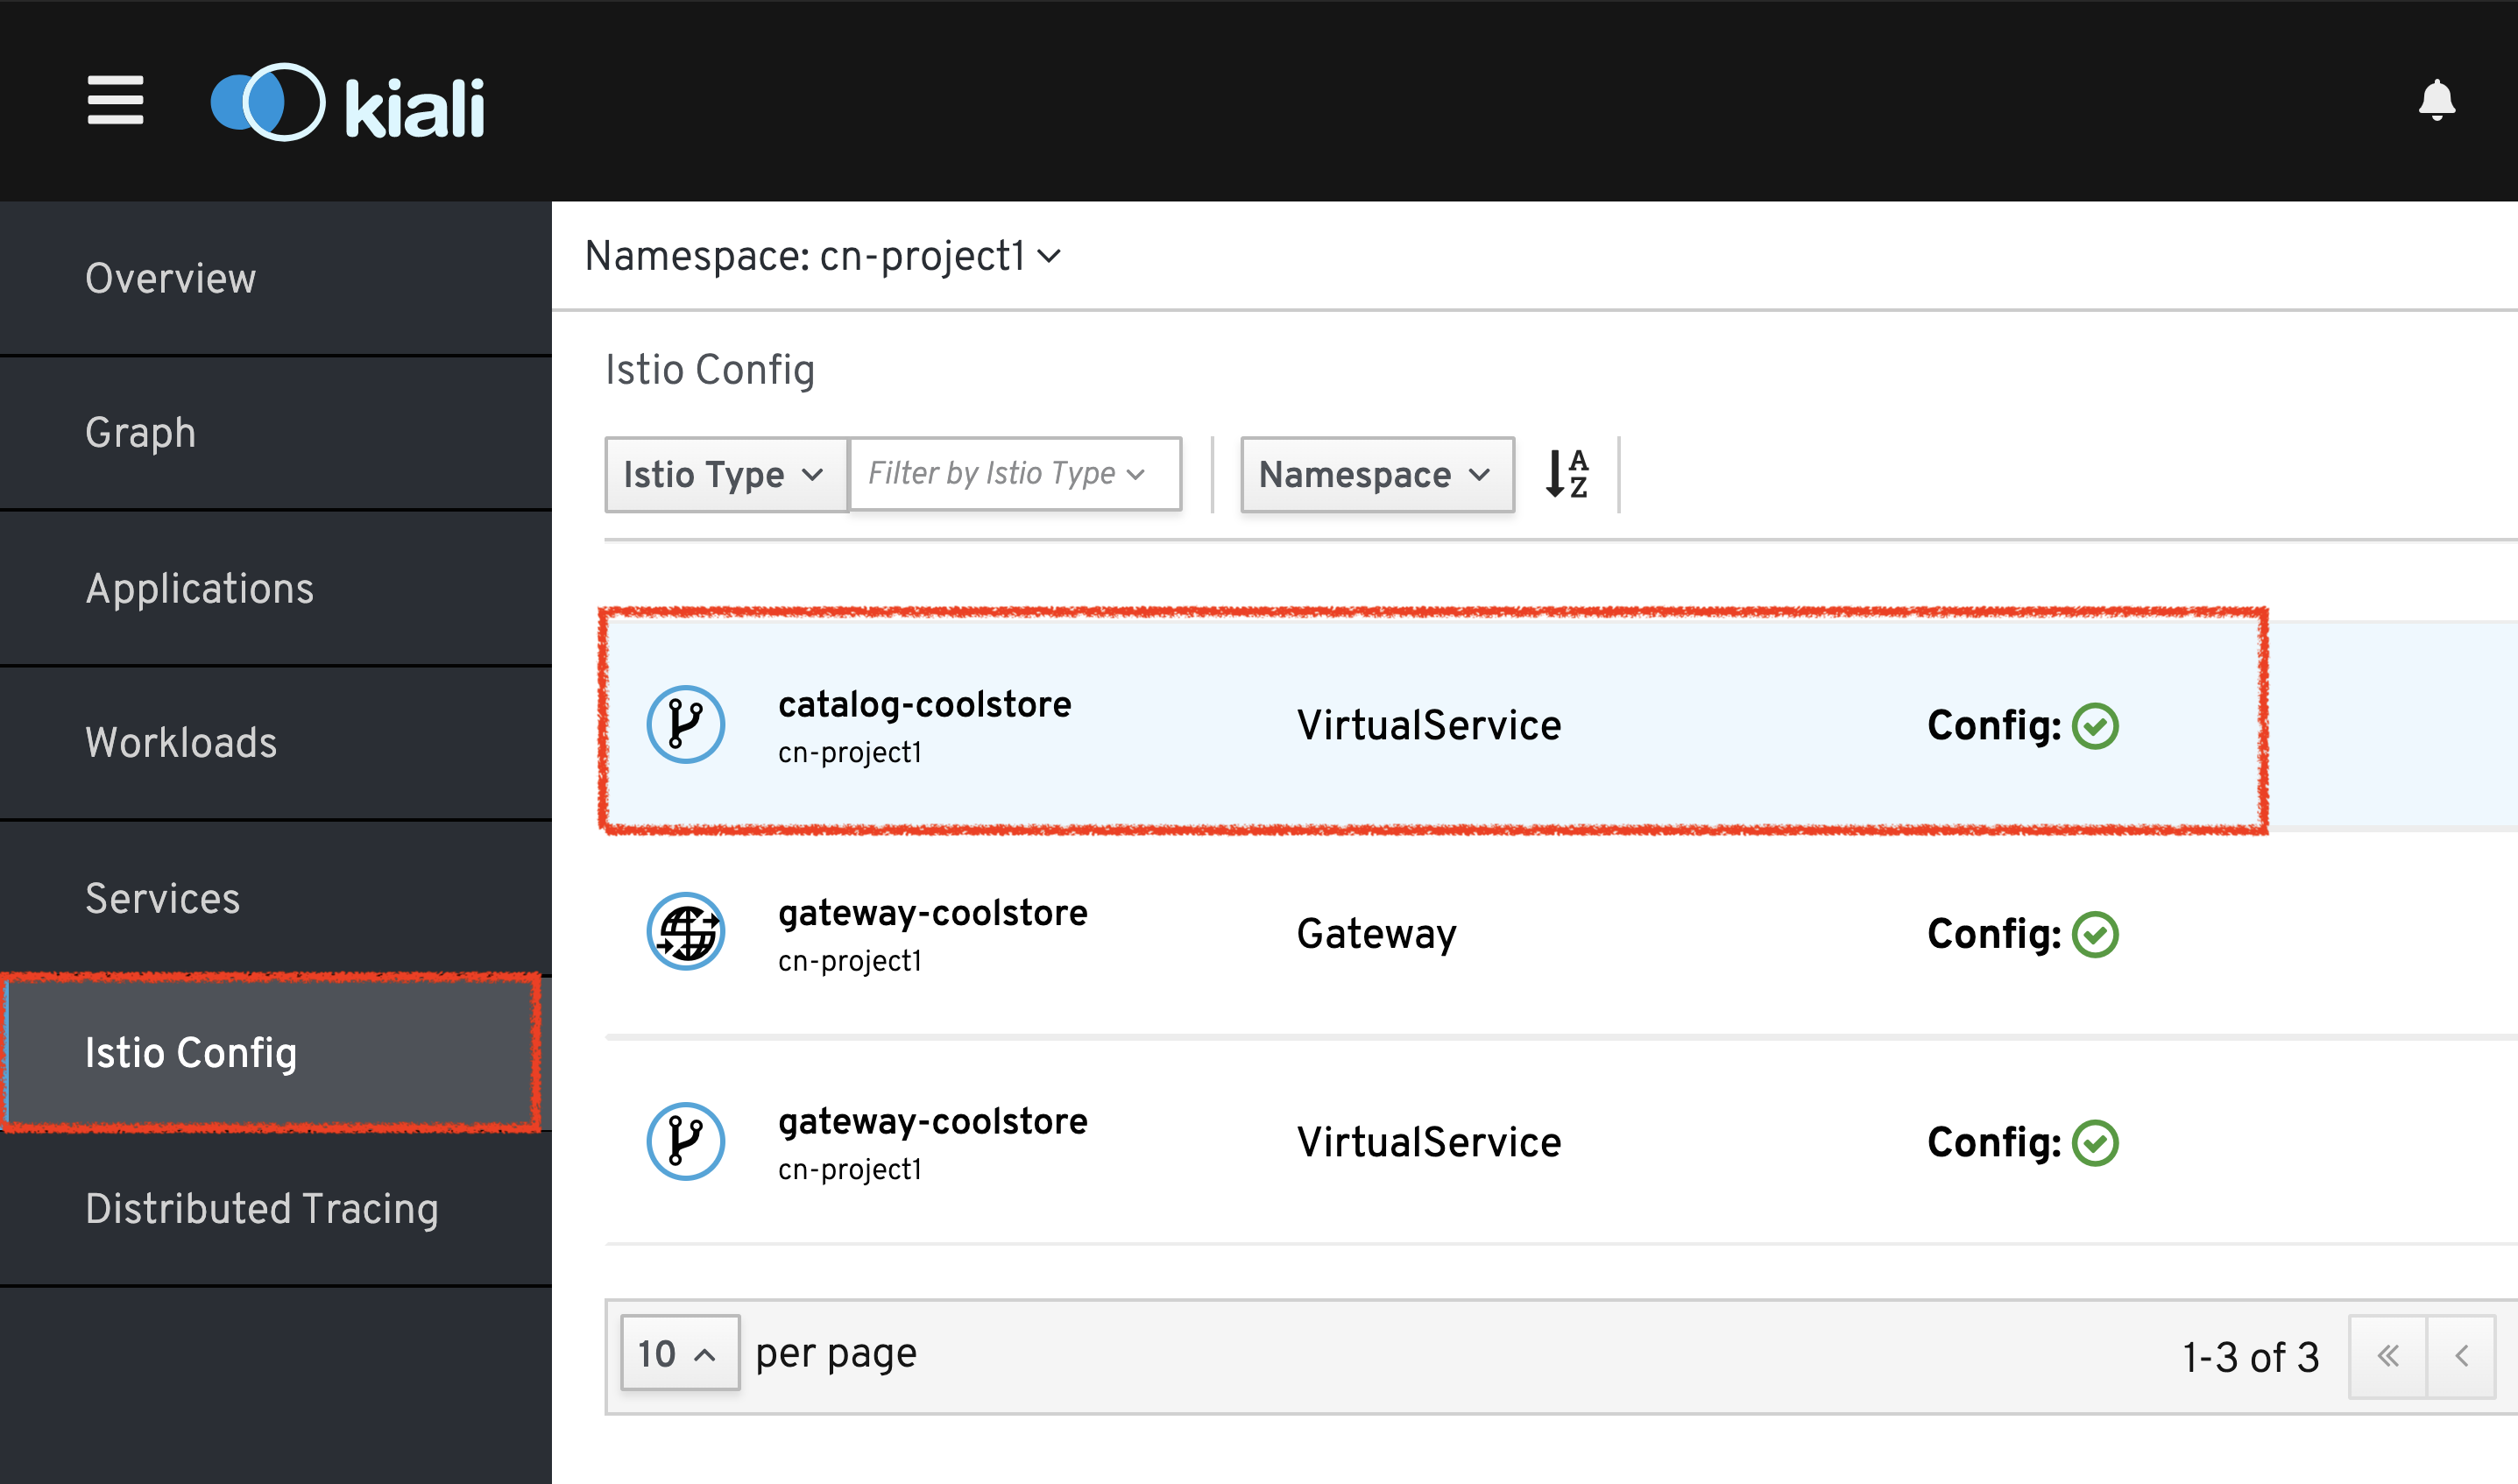
In Kiali Console, click on 'Istio Config' then 'catalog-coolstore' VirtualService
Then, change the configuration as follows
[...]
spec:
  hosts:
    - catalog-coolstore
  gateways: ~
  http:
    - route:
        - destination:
            host: catalog-coolstore
            weight: 0
        - destination:
            host: catalog-coolstore-v2
            weight: 100
[...]
Now, in your Workspace, in the '>_ Gateway - Generate Traffic' terminal window, you likely see only 'Gateway ⇒ Catalog GoLang (v2)' in the '>_ Gateway - Generate Traffic terminal'.
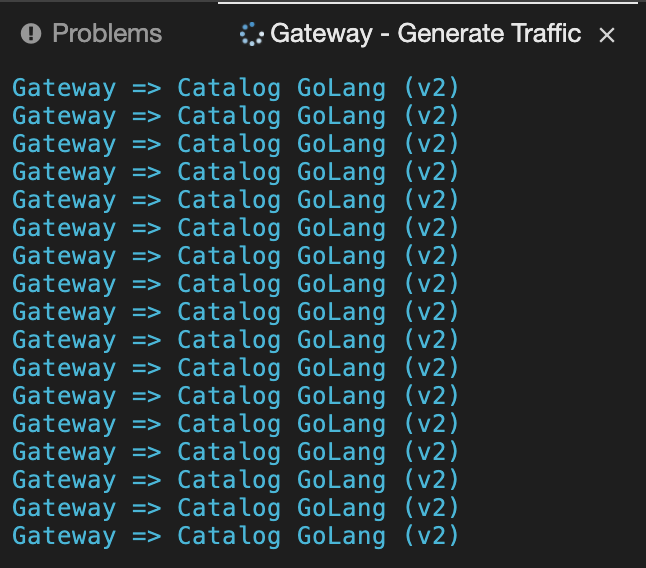
And from Kiali Console, you can visualize that 100% of the traffic is switching gradually to Catalog Service v2.
That’s all for this lab! You are ready to move on to the next lab.